How can a simulated hospital define requirements, coordinate stakeholders, analyse appointment and resource data, and plan process changes and risk controls?
IBM learning capstone · CAPSTONE | 6 local-complete, 3 partial
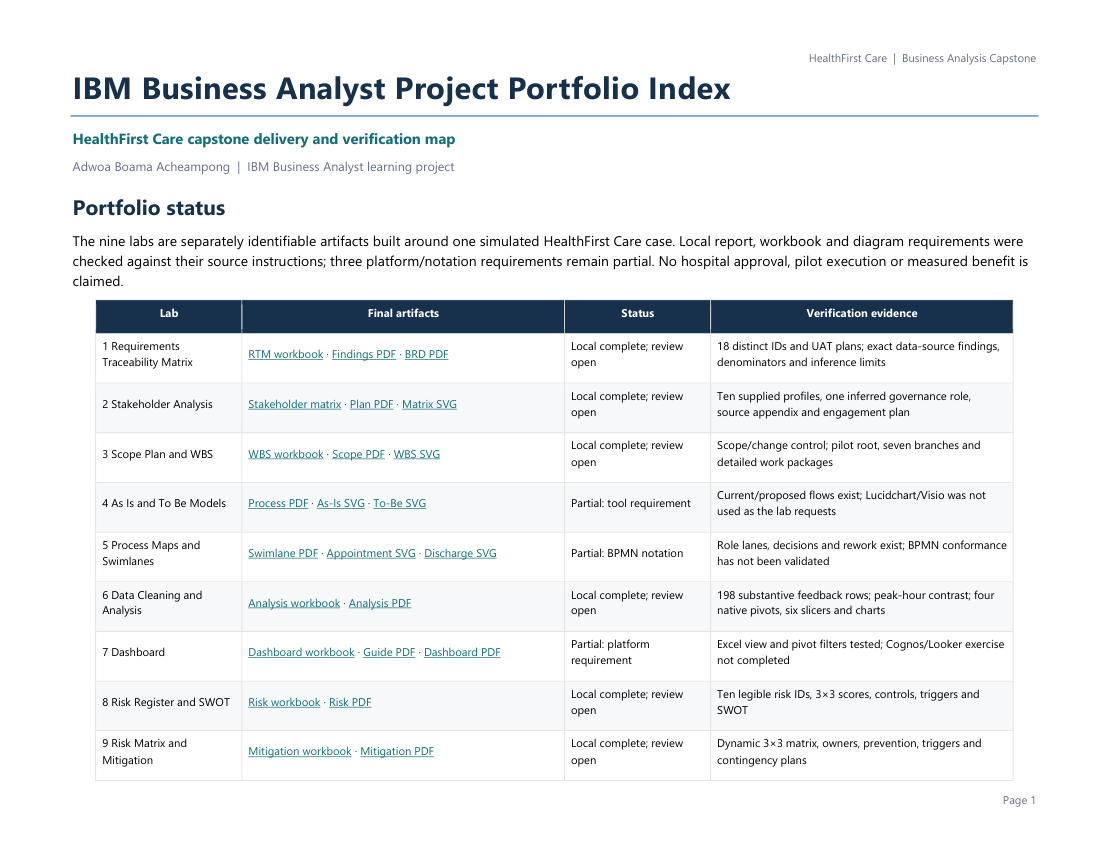
I developed nine related business-analysis labs around the simulated HealthFirst Care case. The pack connects requirements and traceability with stakeholder planning, scope, process models, analysis, a dashboard and risk mitigation. Six labs are complete locally with review open; three retain specific platform or notation requirements.
What the work shows
- One coherent capstone
- 9 labs
Six local-complete labs with review open, and three partial platform/notation requirements.
- Separate editable workbooks
- 7 XLSX files
Each workbook serves its own lab; the earlier combined draft is superseded.
- Interactive Excel dashboard
- 200 → 38
Appointment KPI response to the Cardiology slicer in the desktop interaction check.
Approach and tools
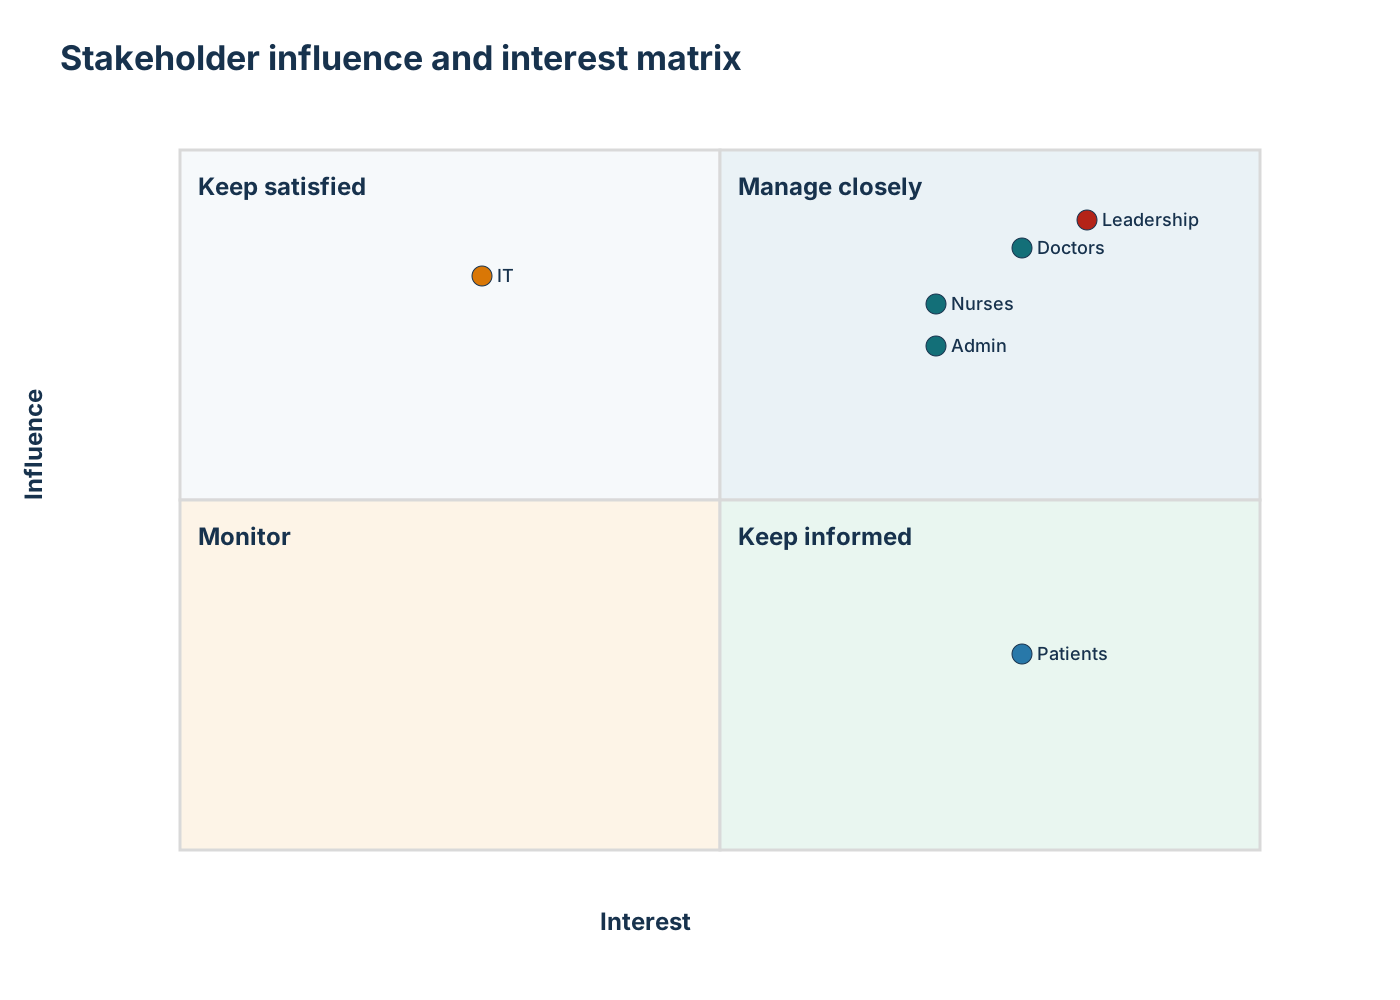
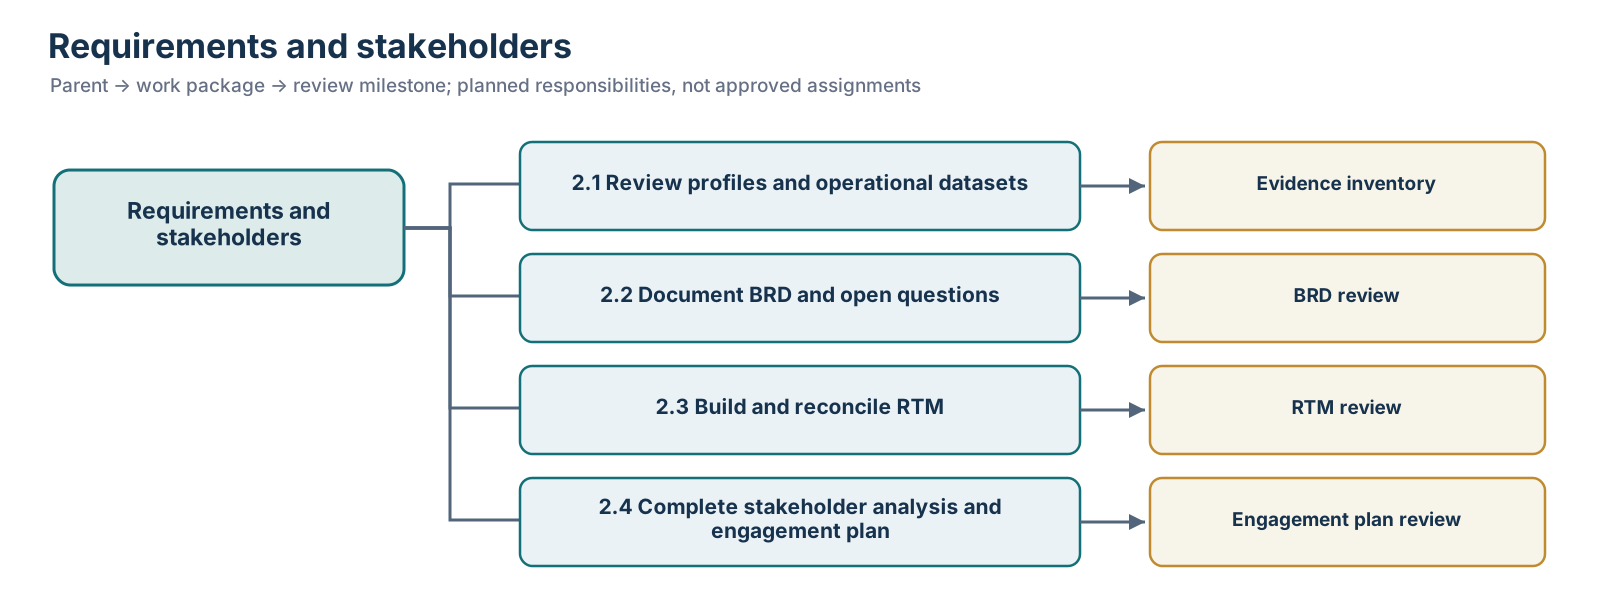
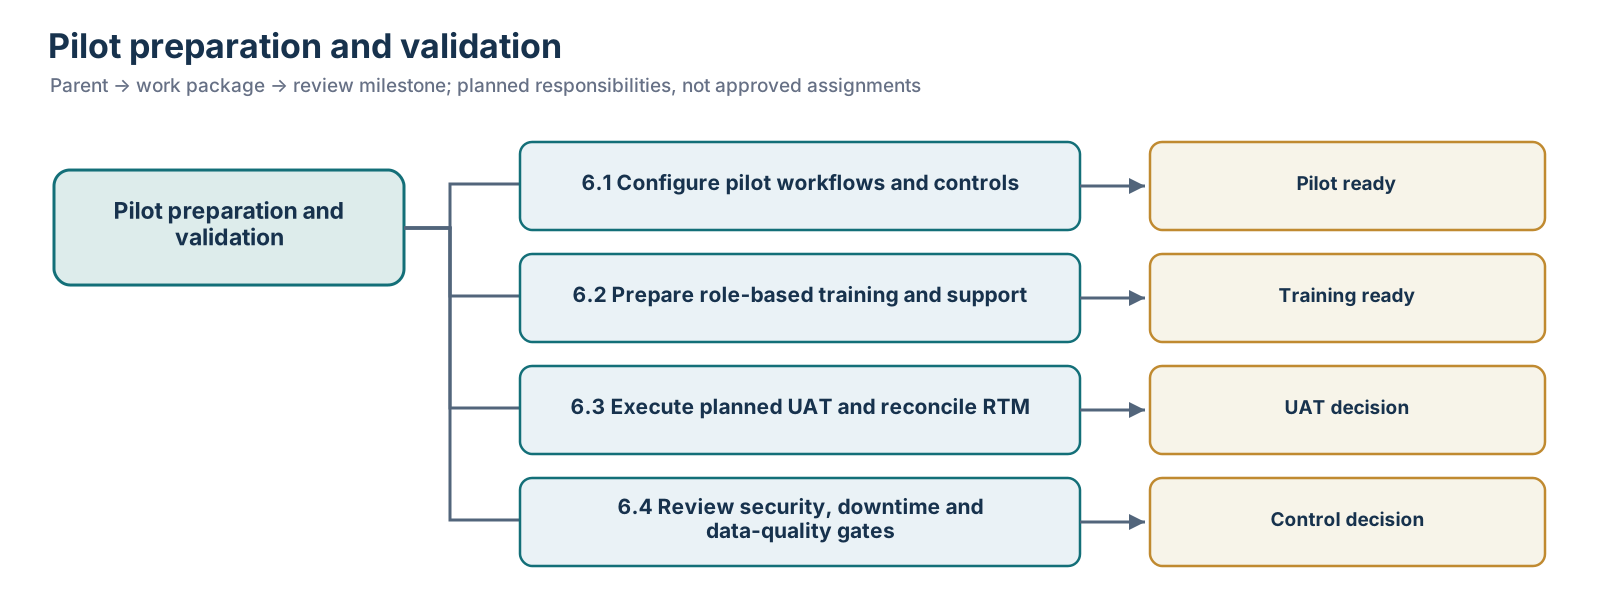
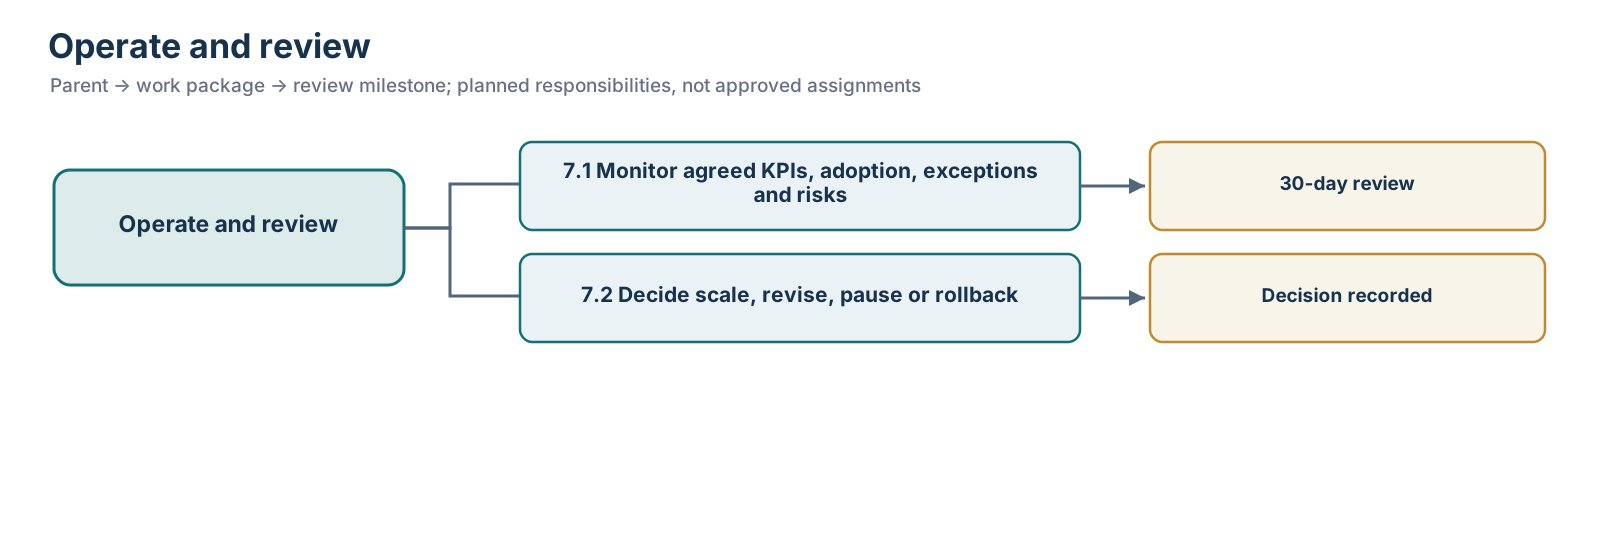
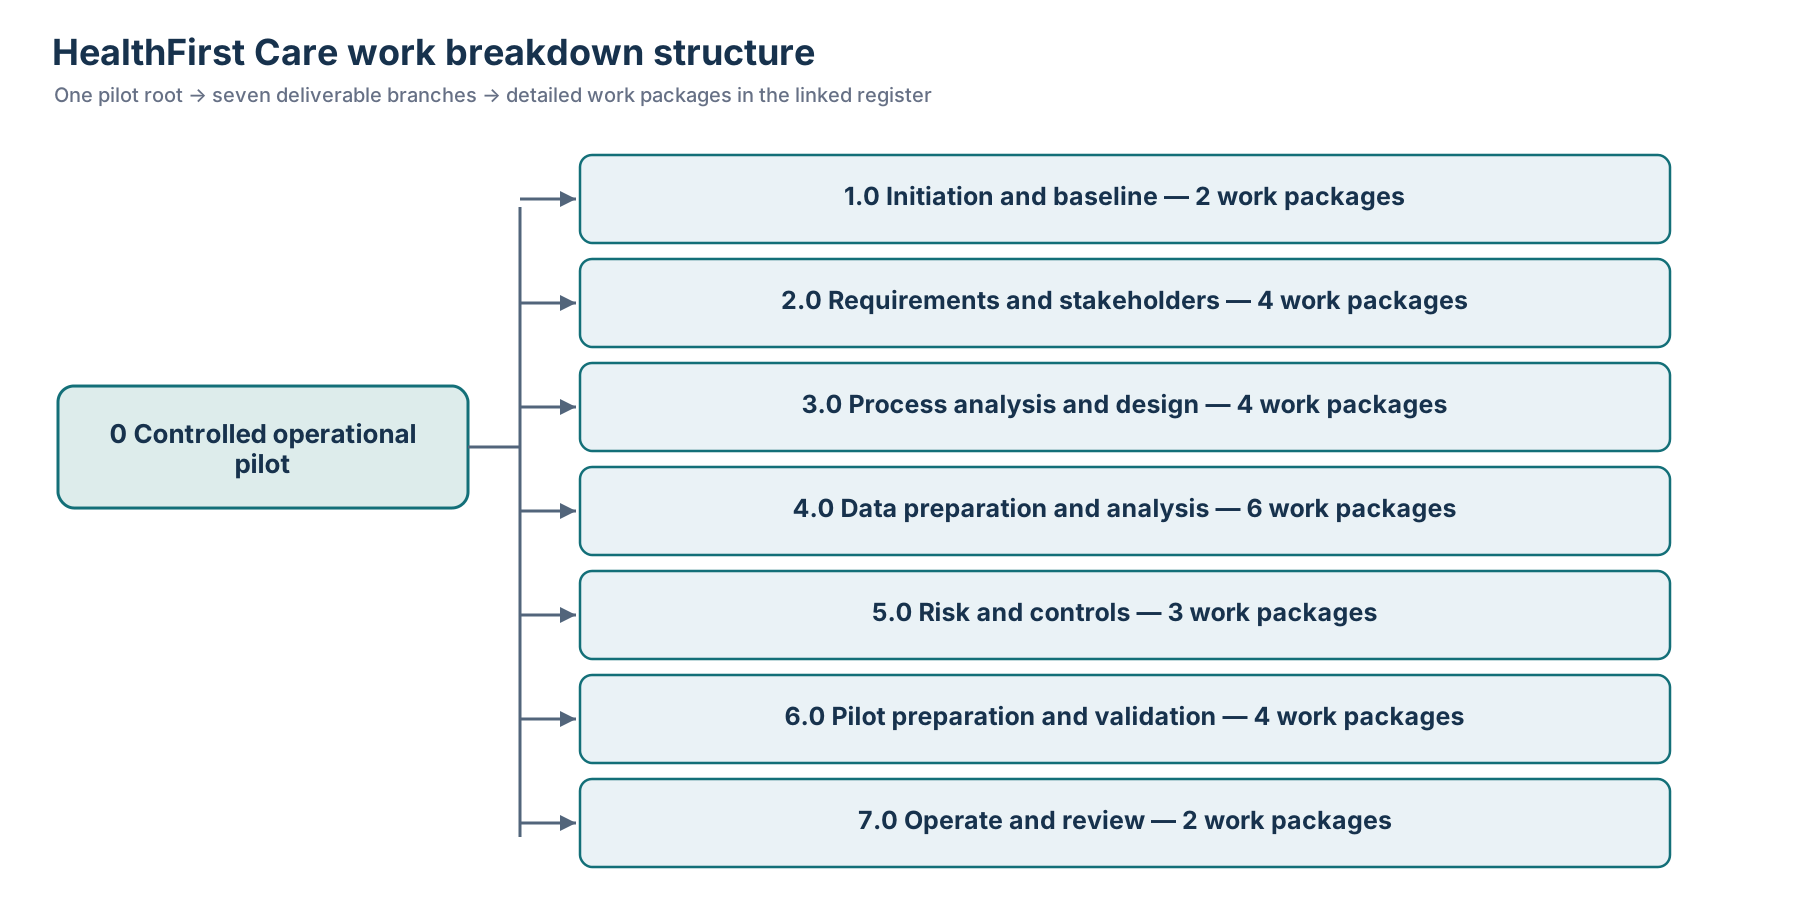
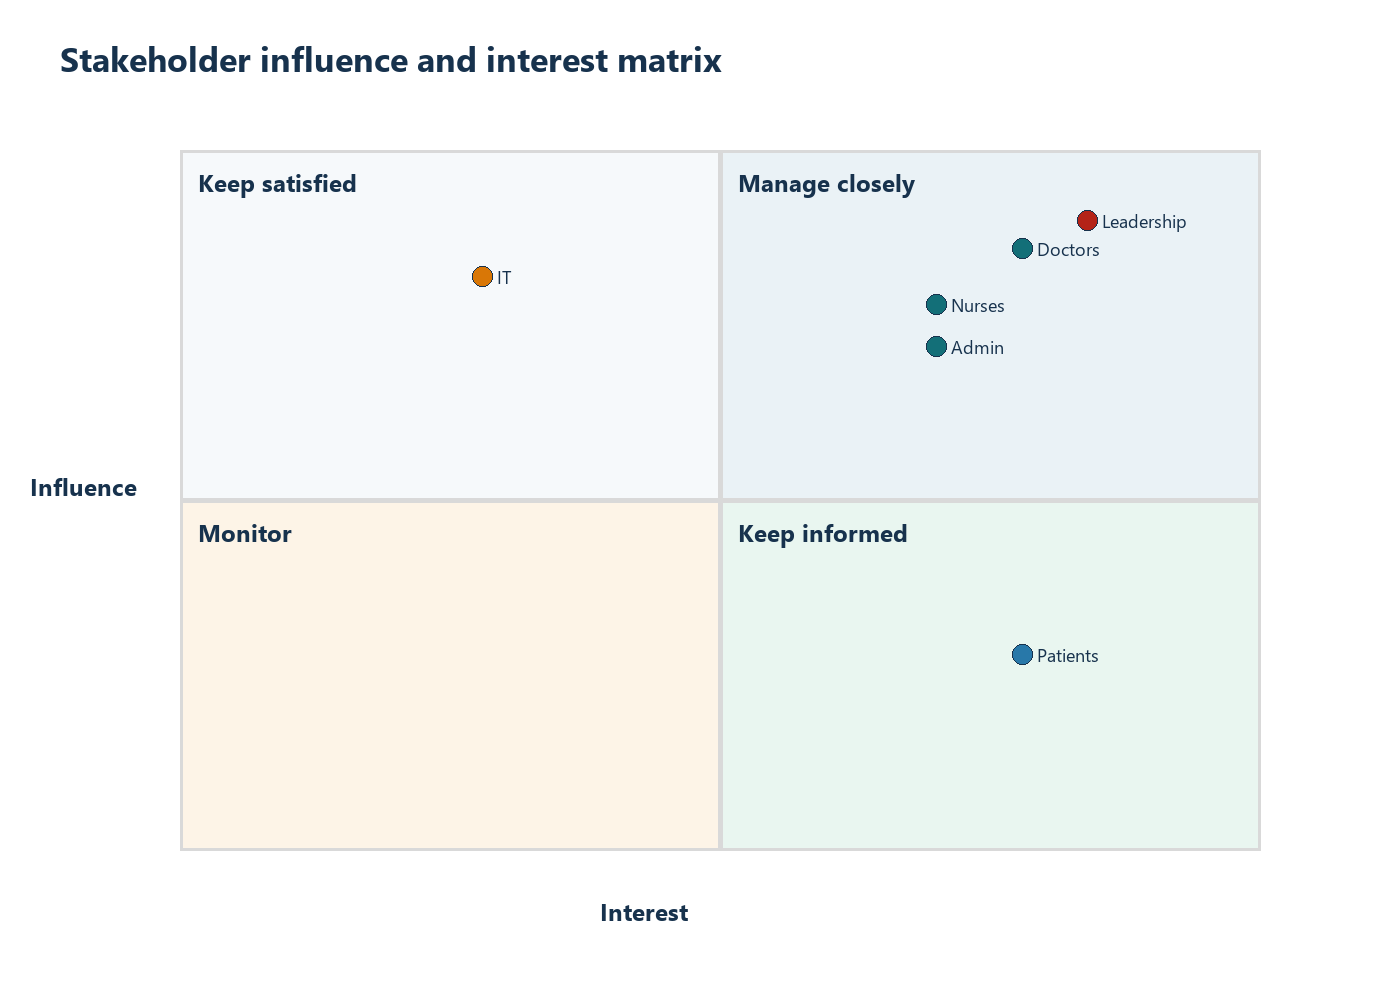
The BRD and RTM connect 18 distinct requirement IDs with their sources and planned UAT. The stakeholder analysis, engagement plan and WBS make responsibilities, scope boundaries and change control explicit.
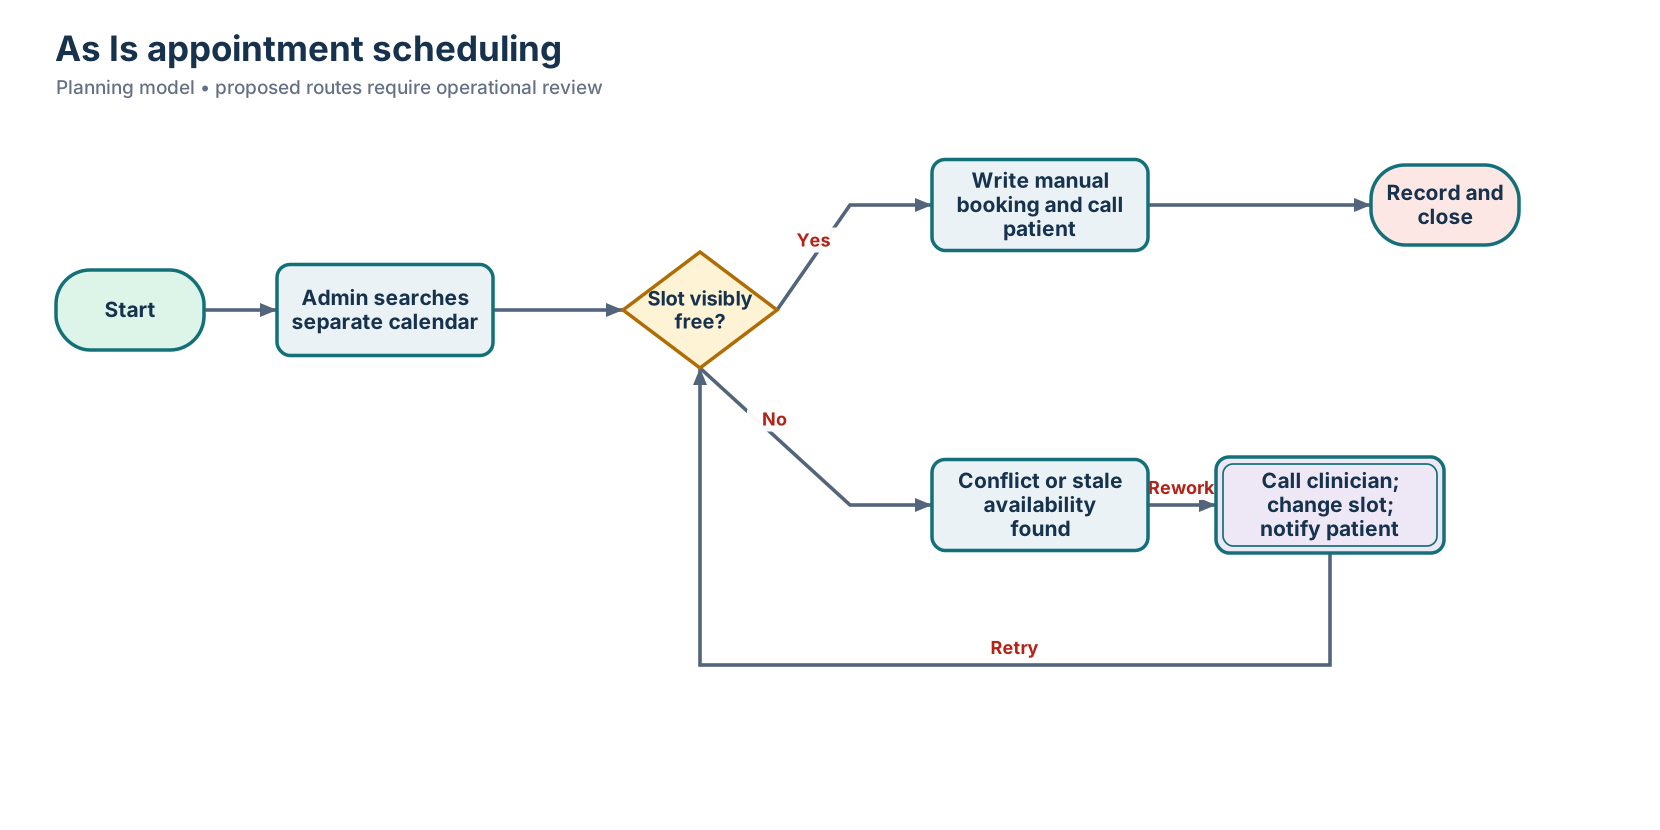
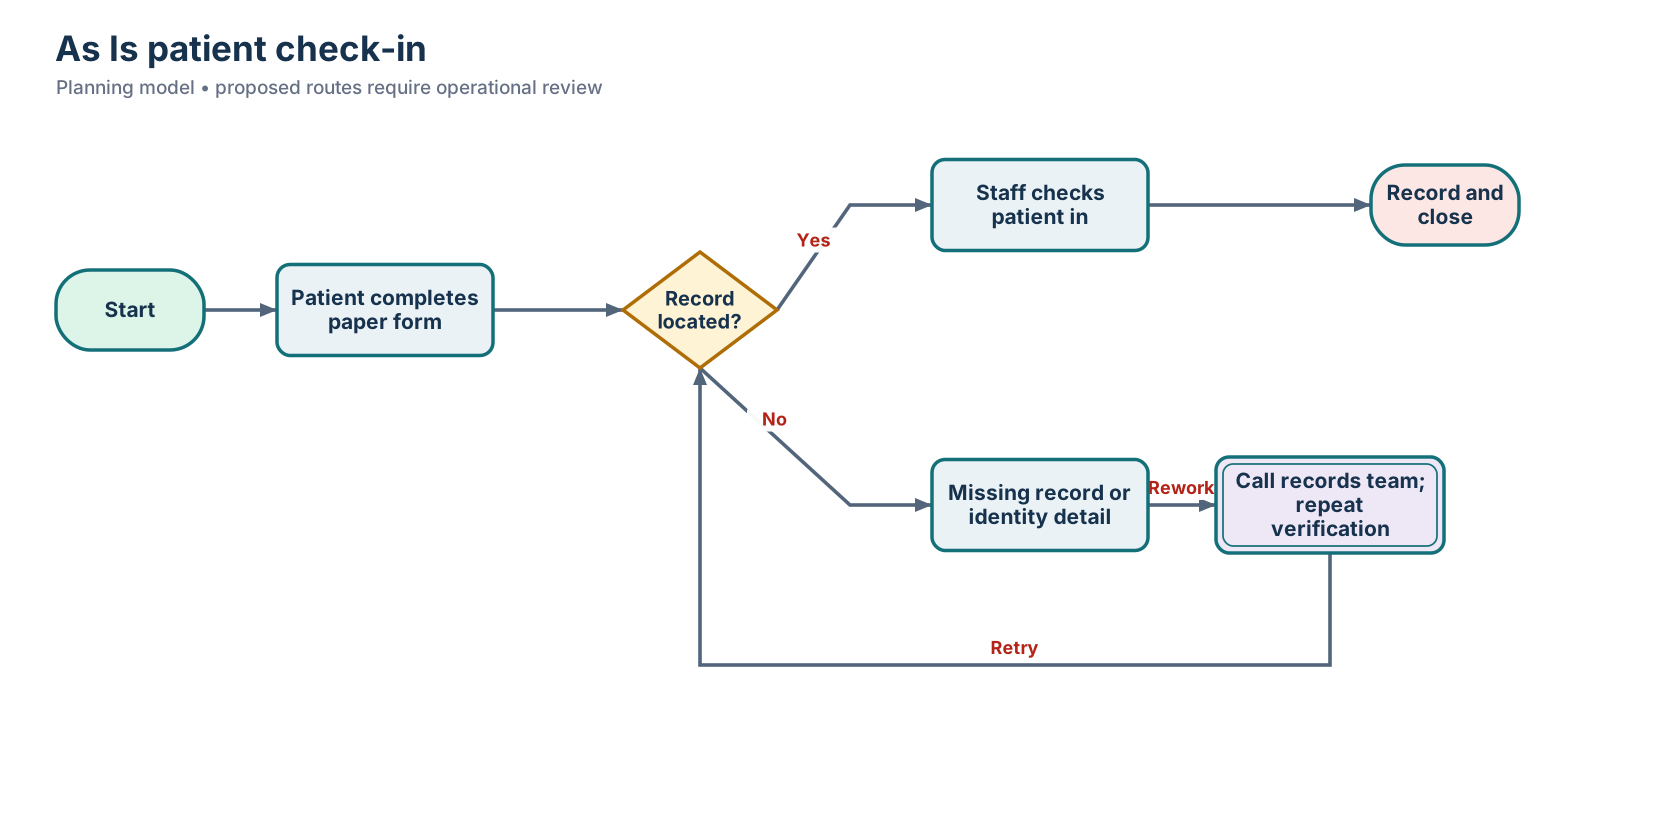
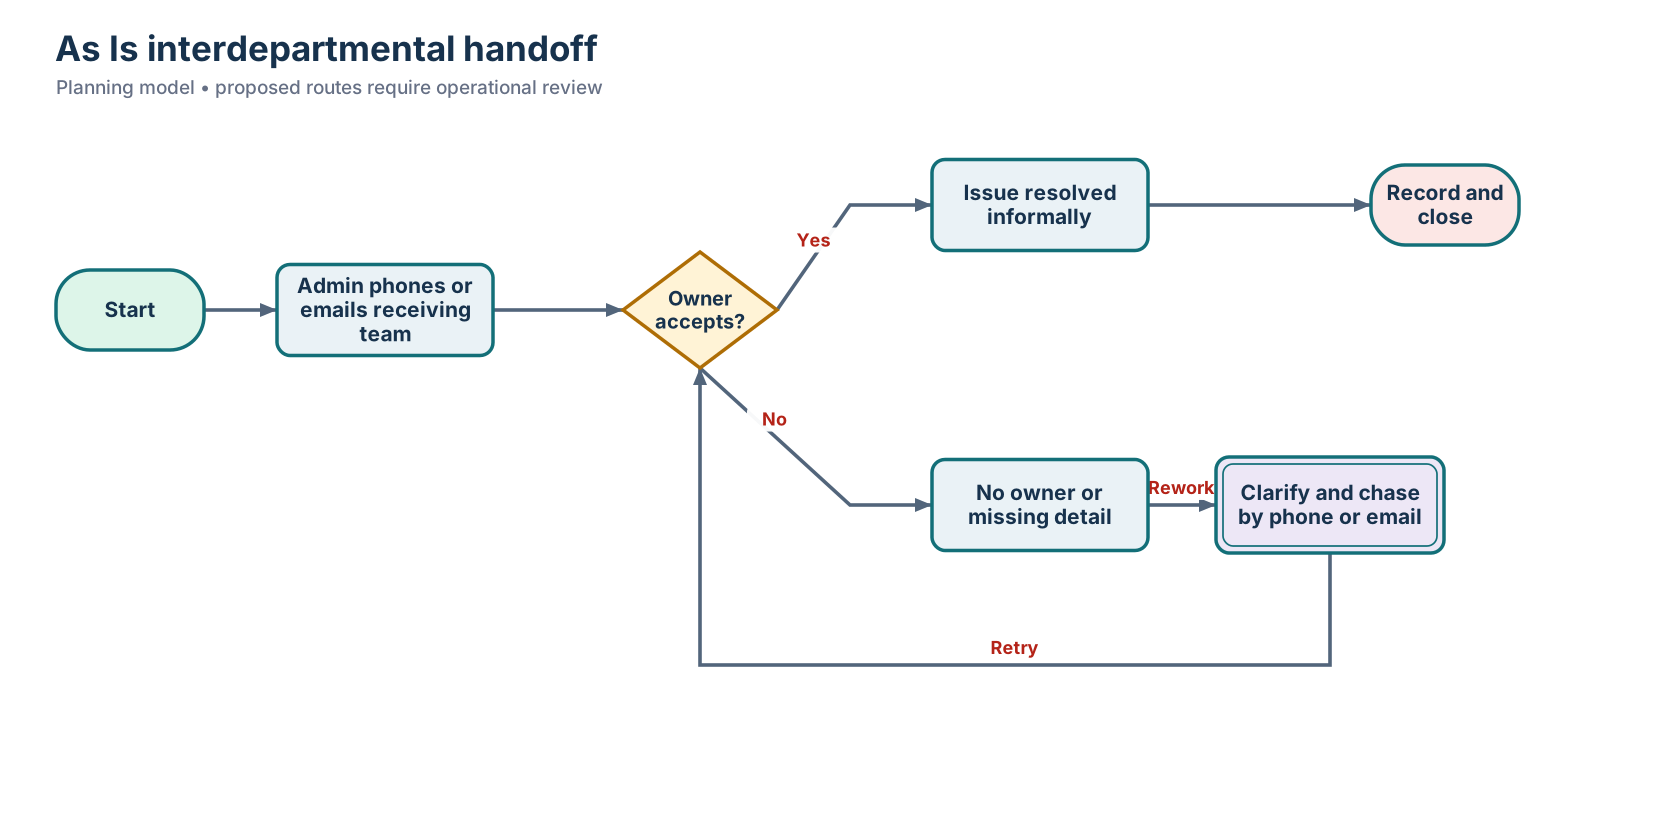
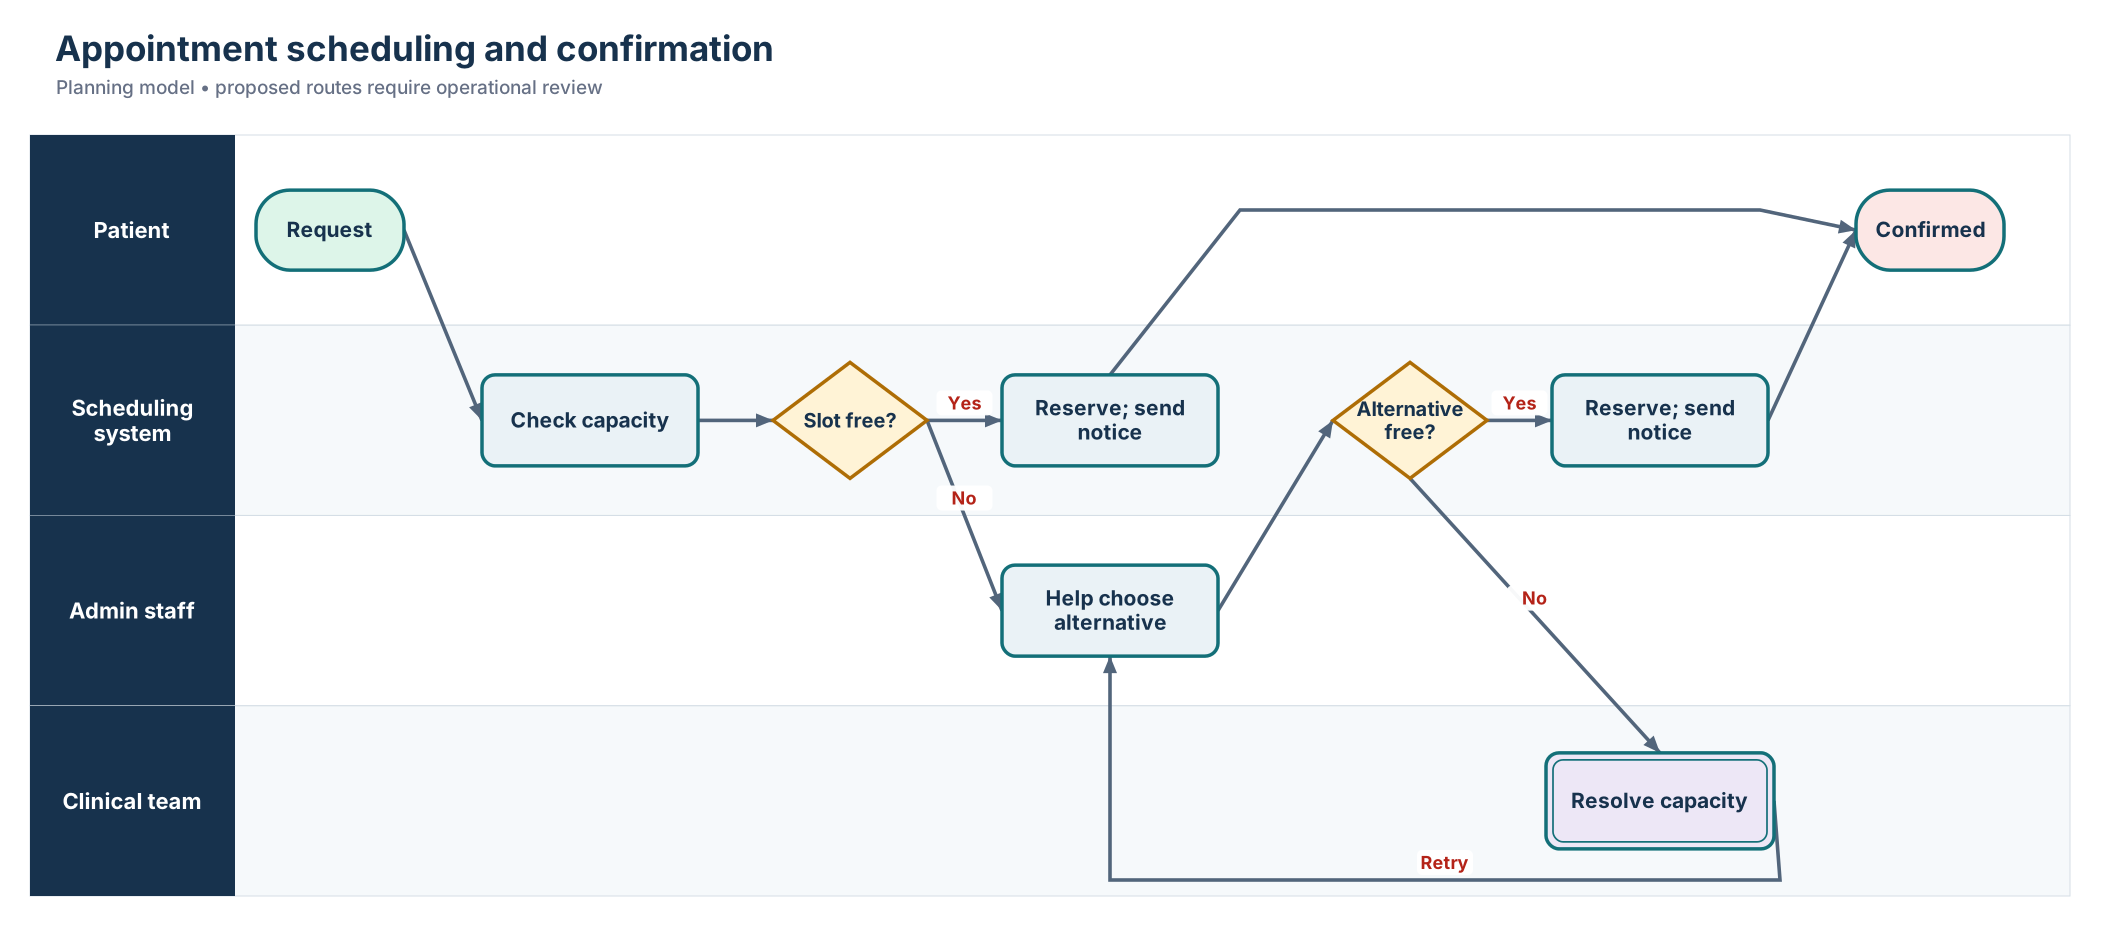
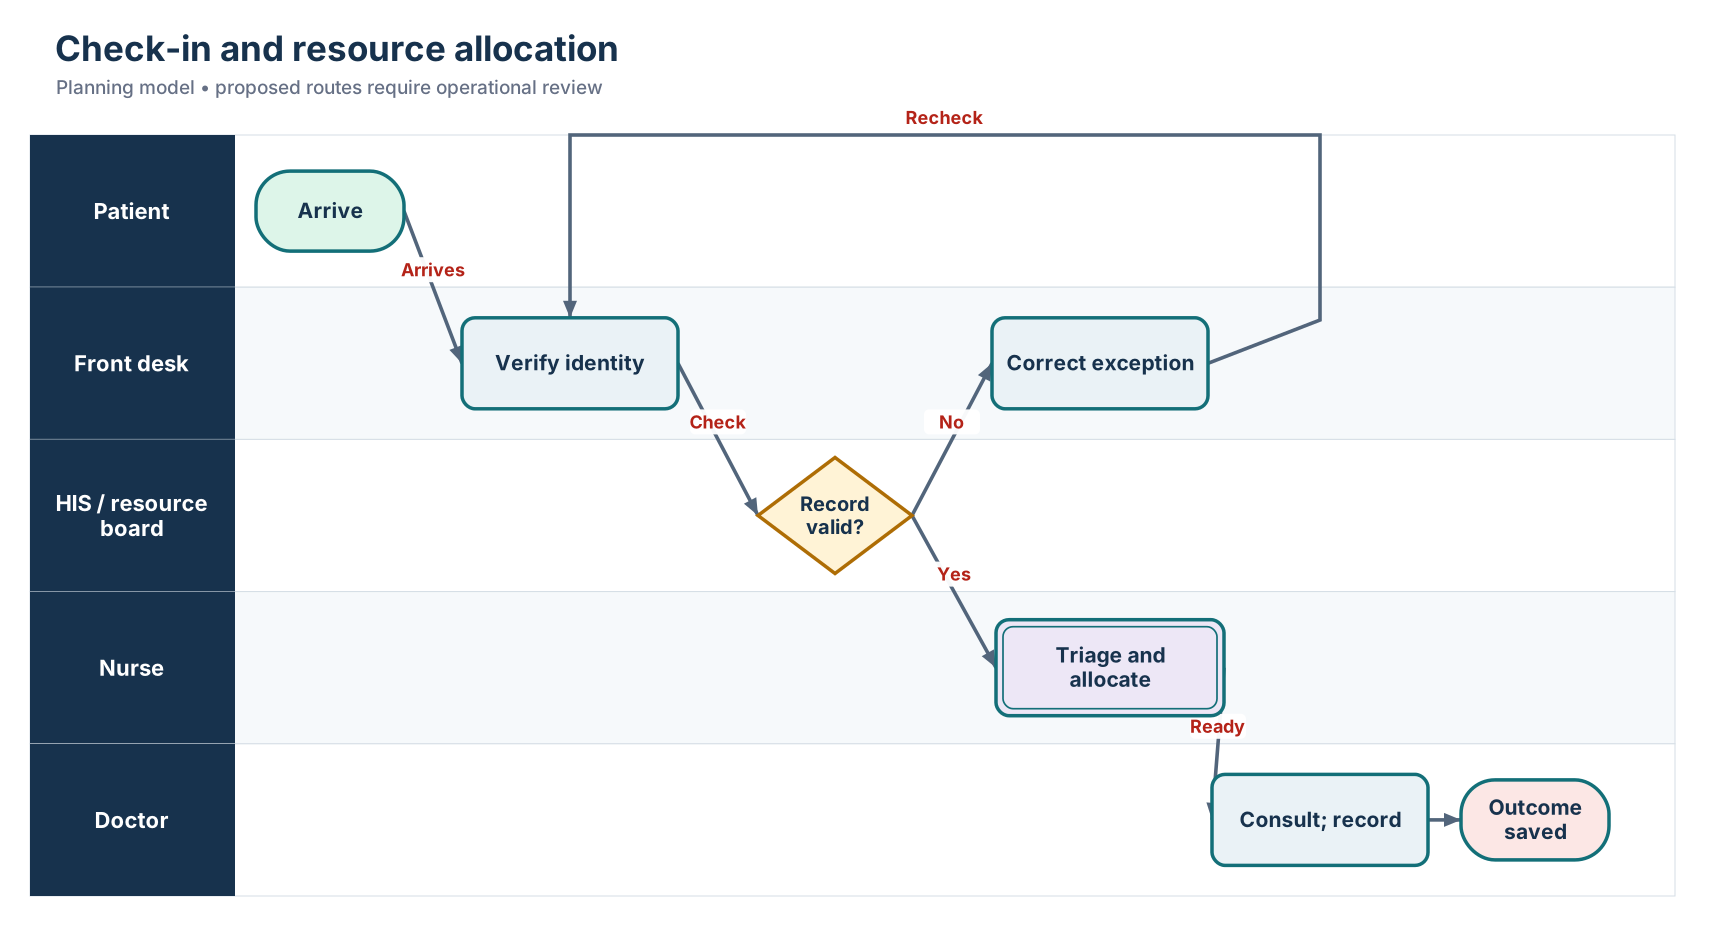
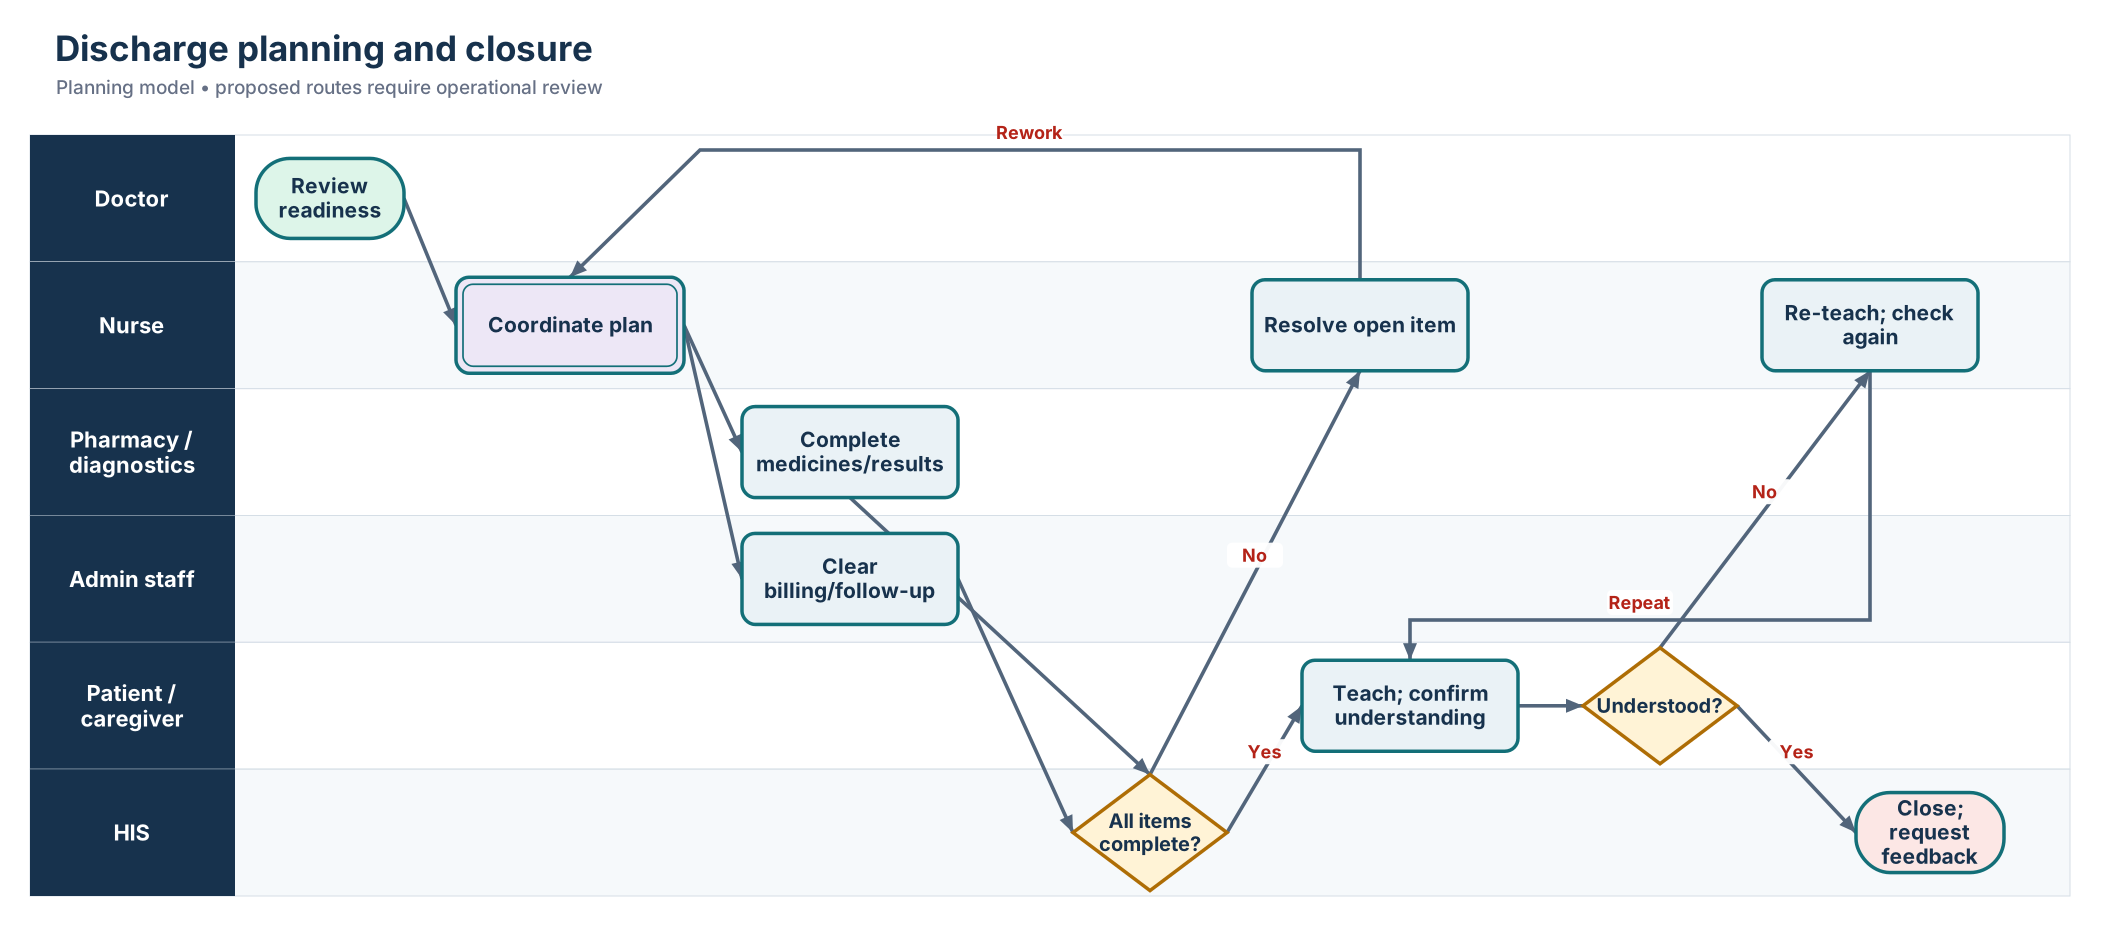
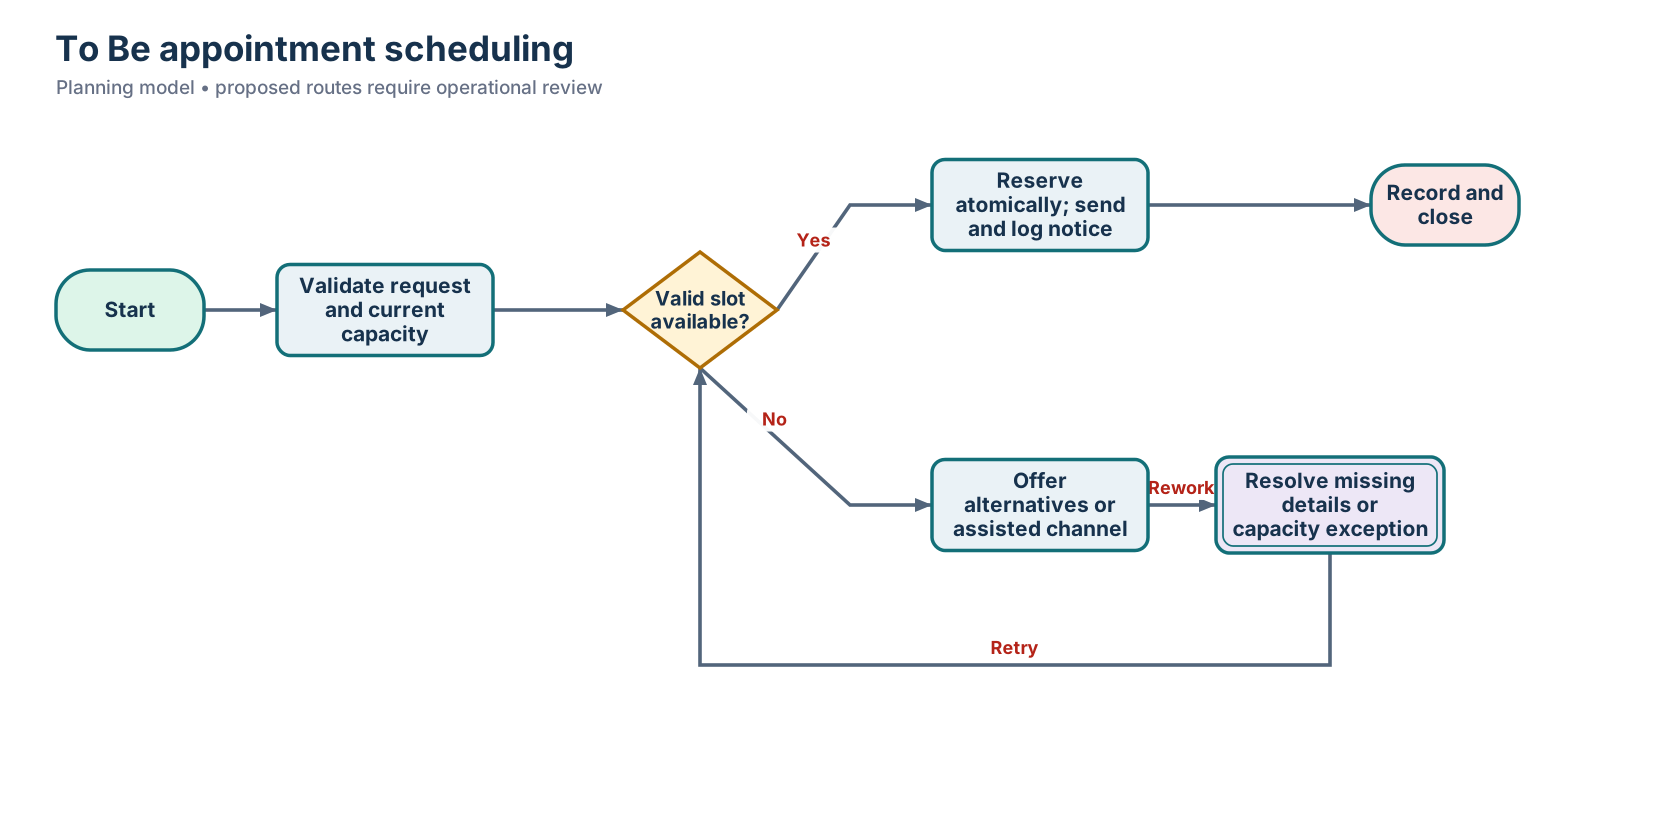
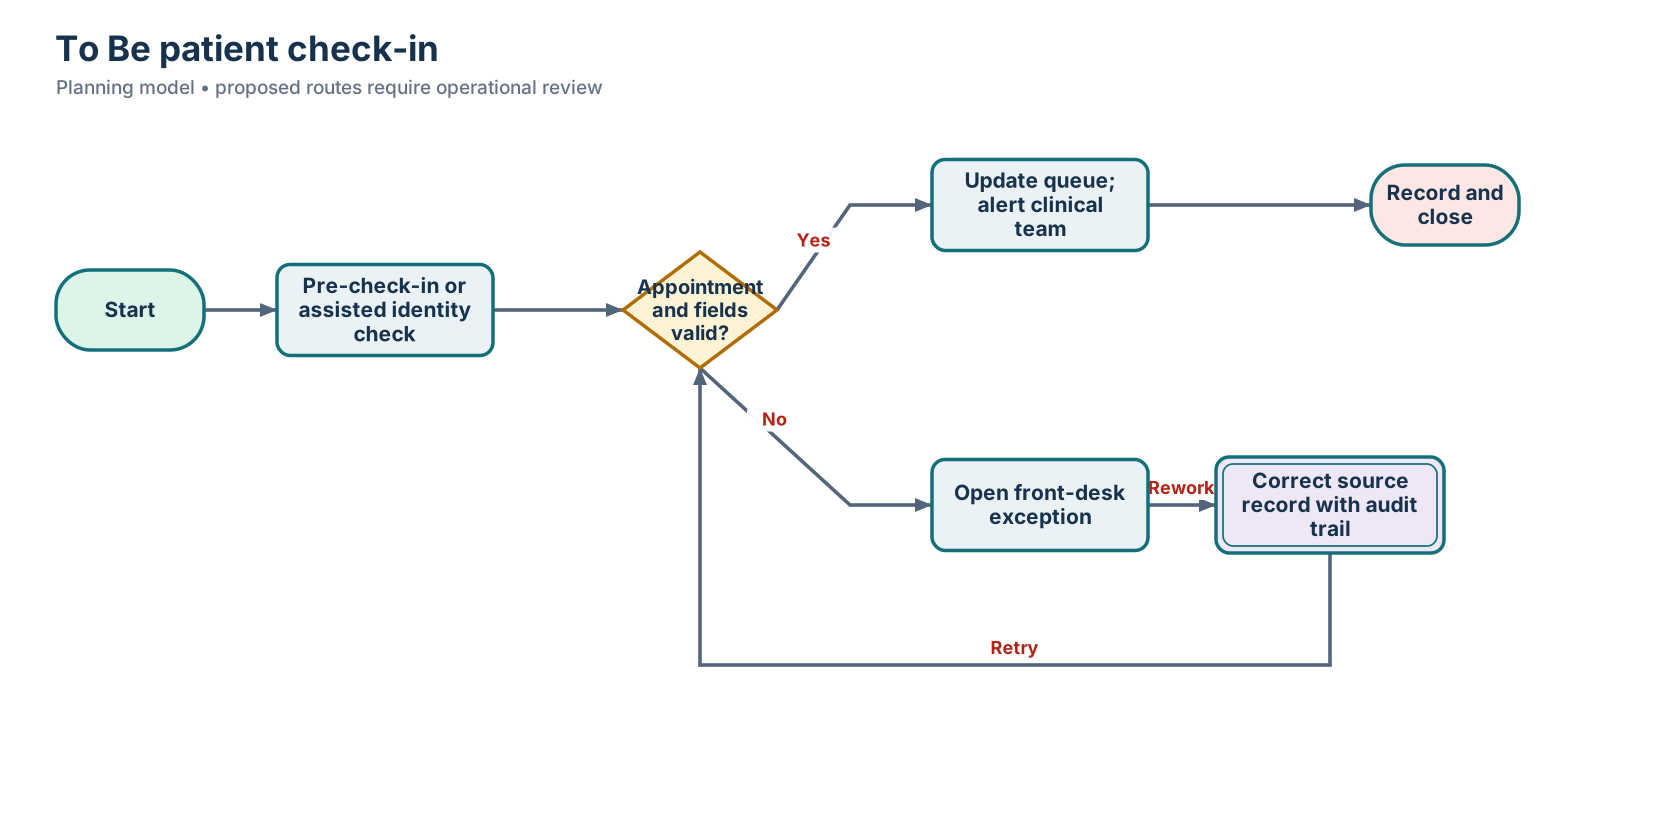
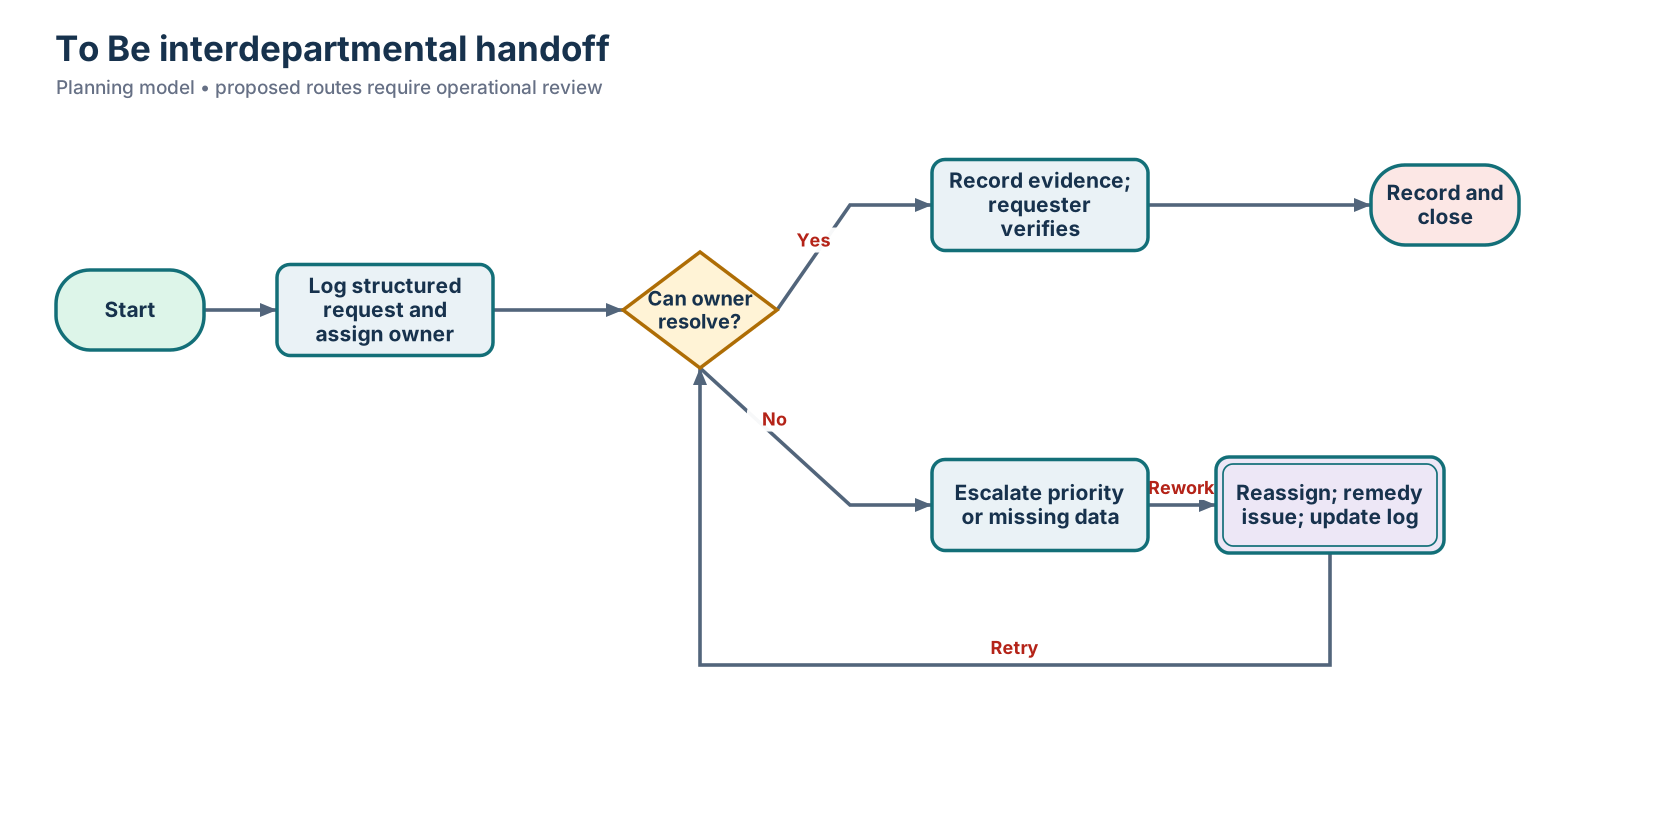
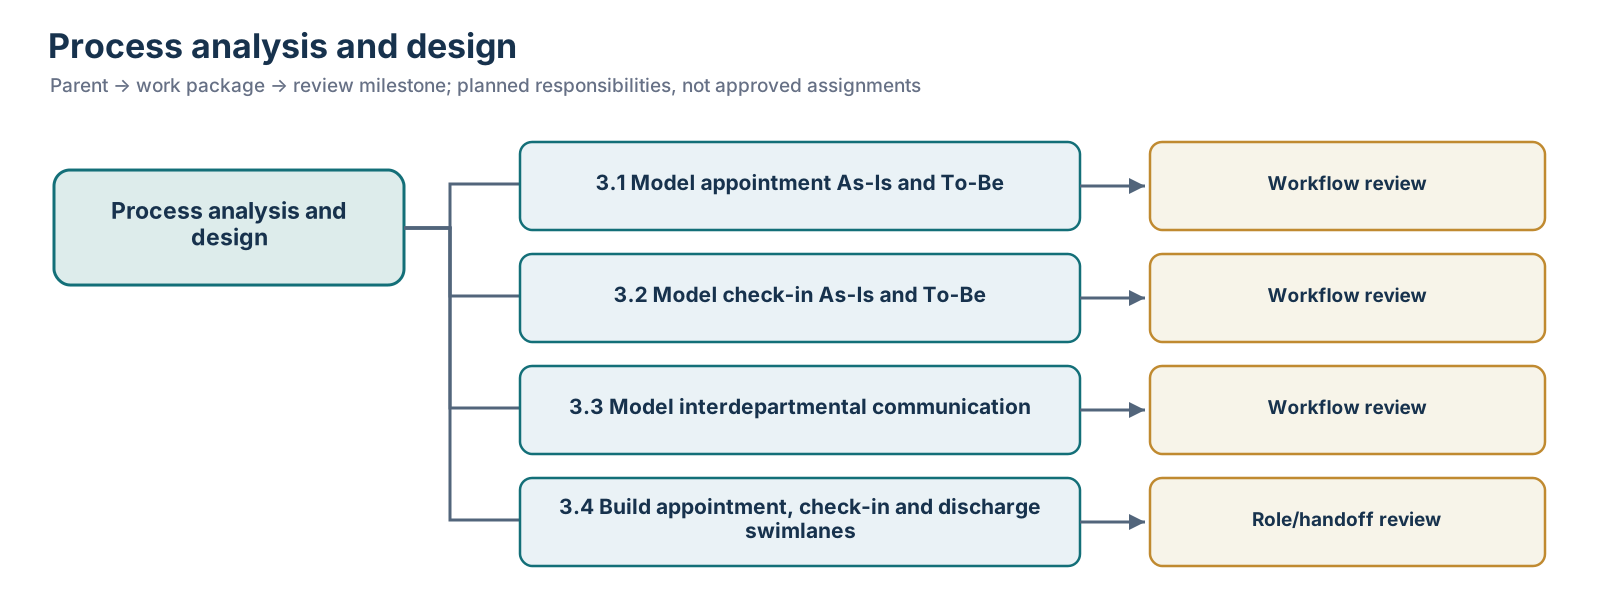
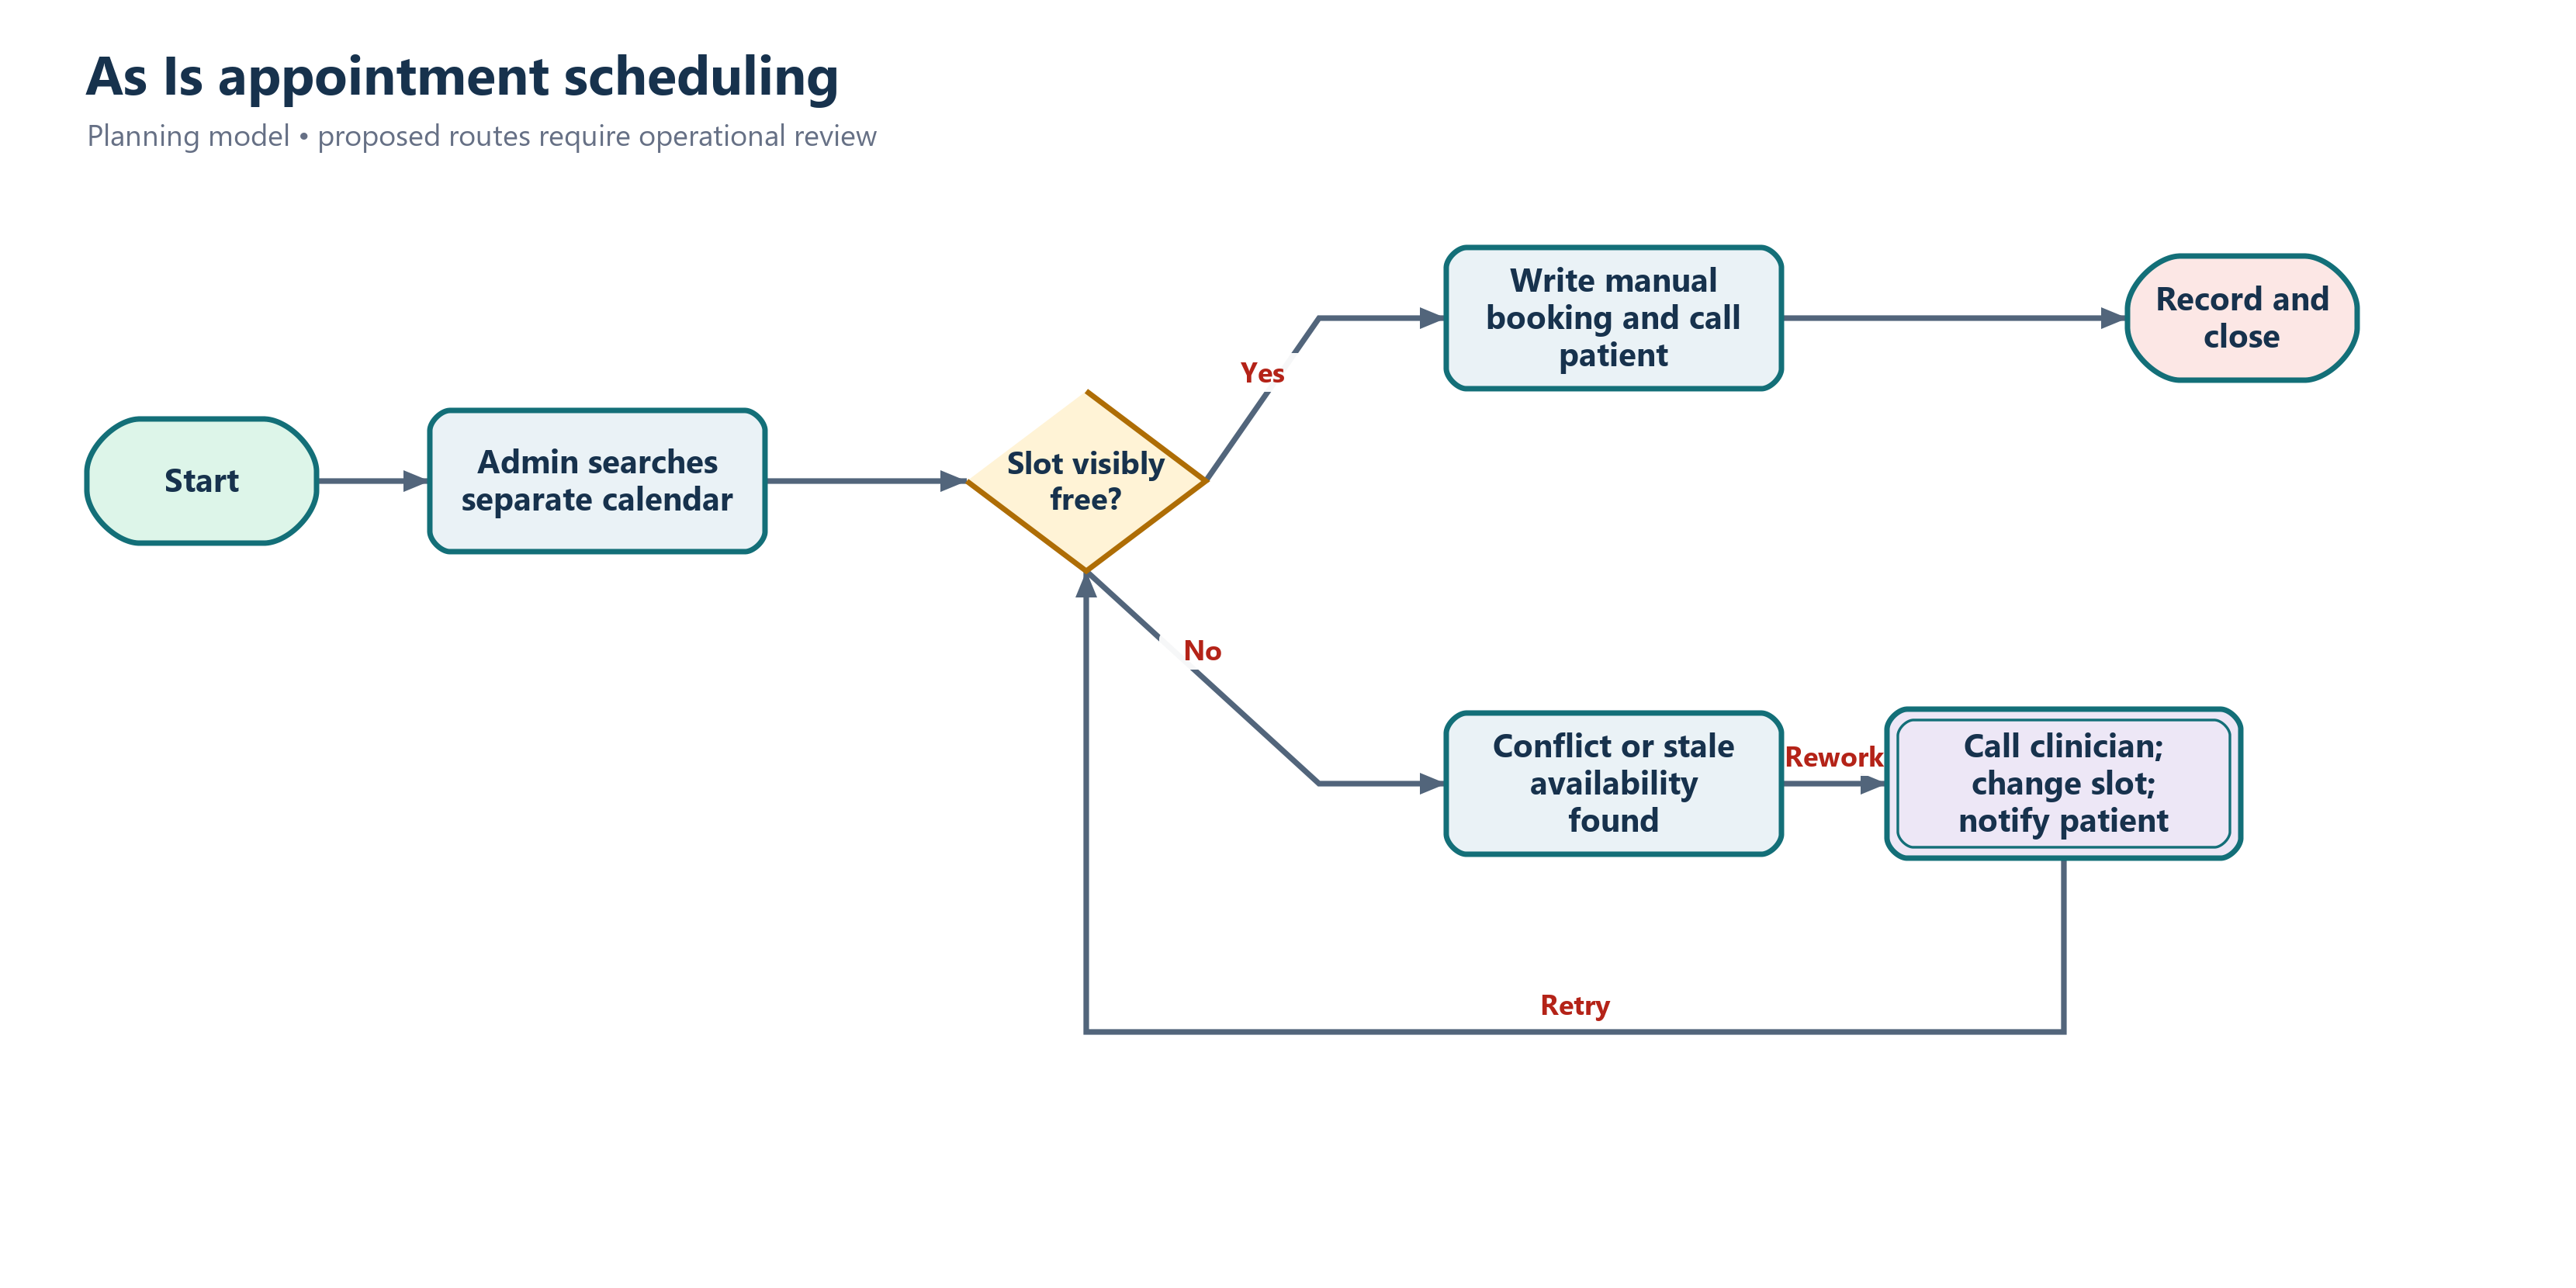
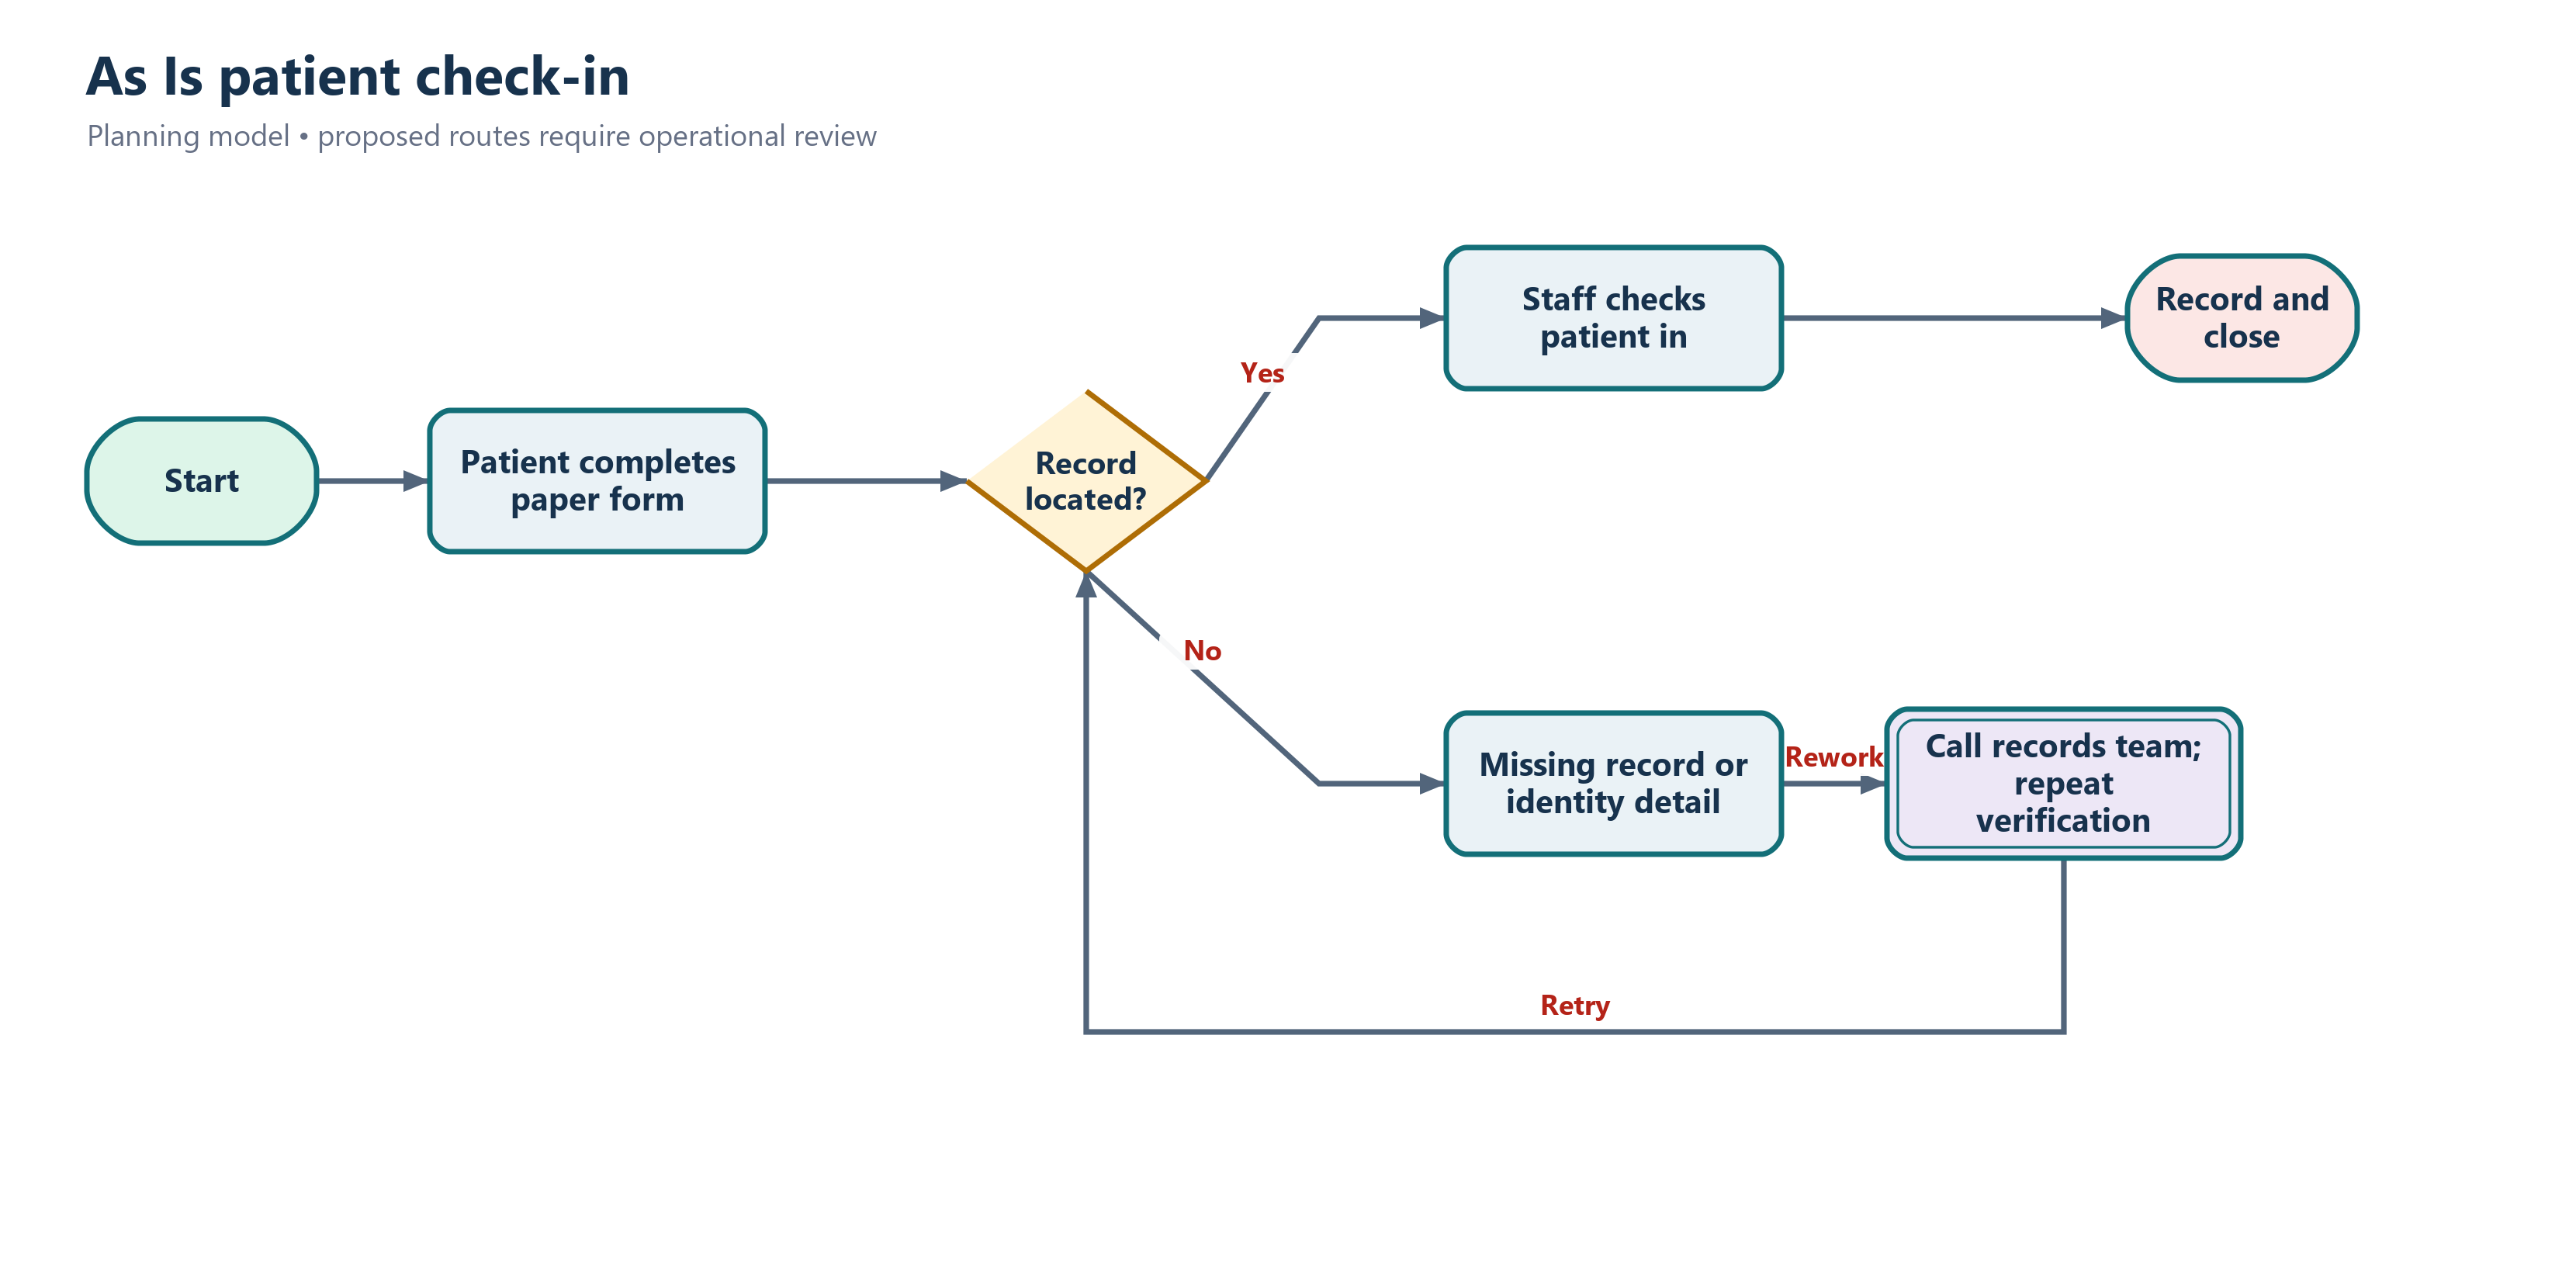
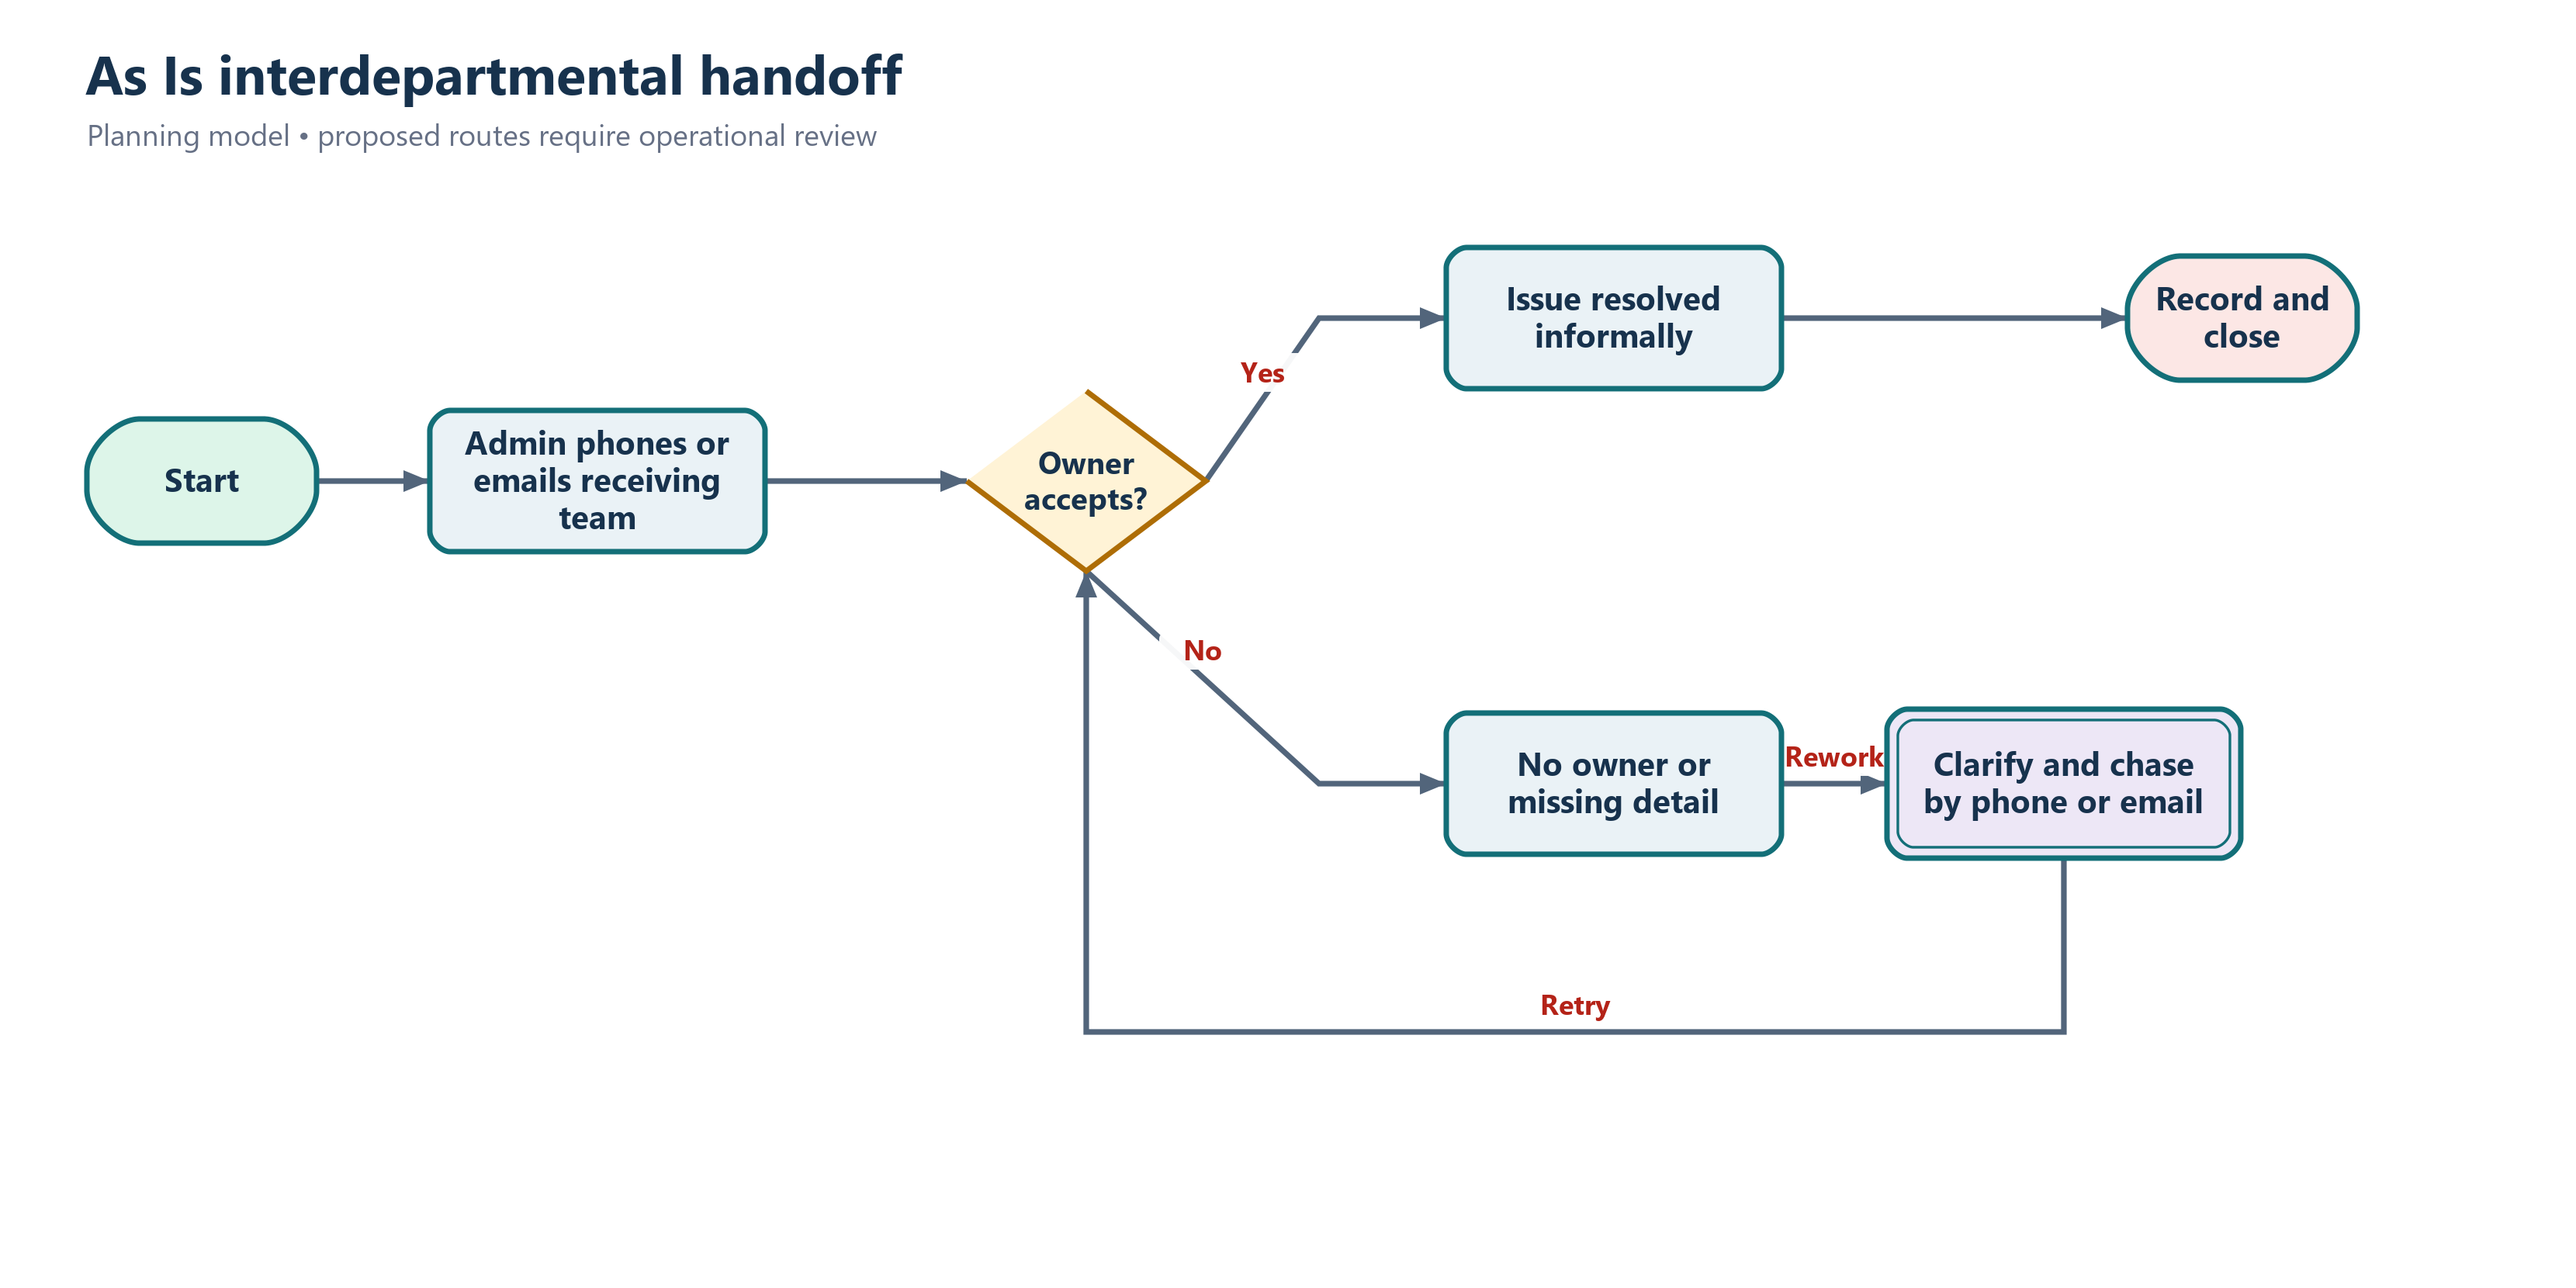
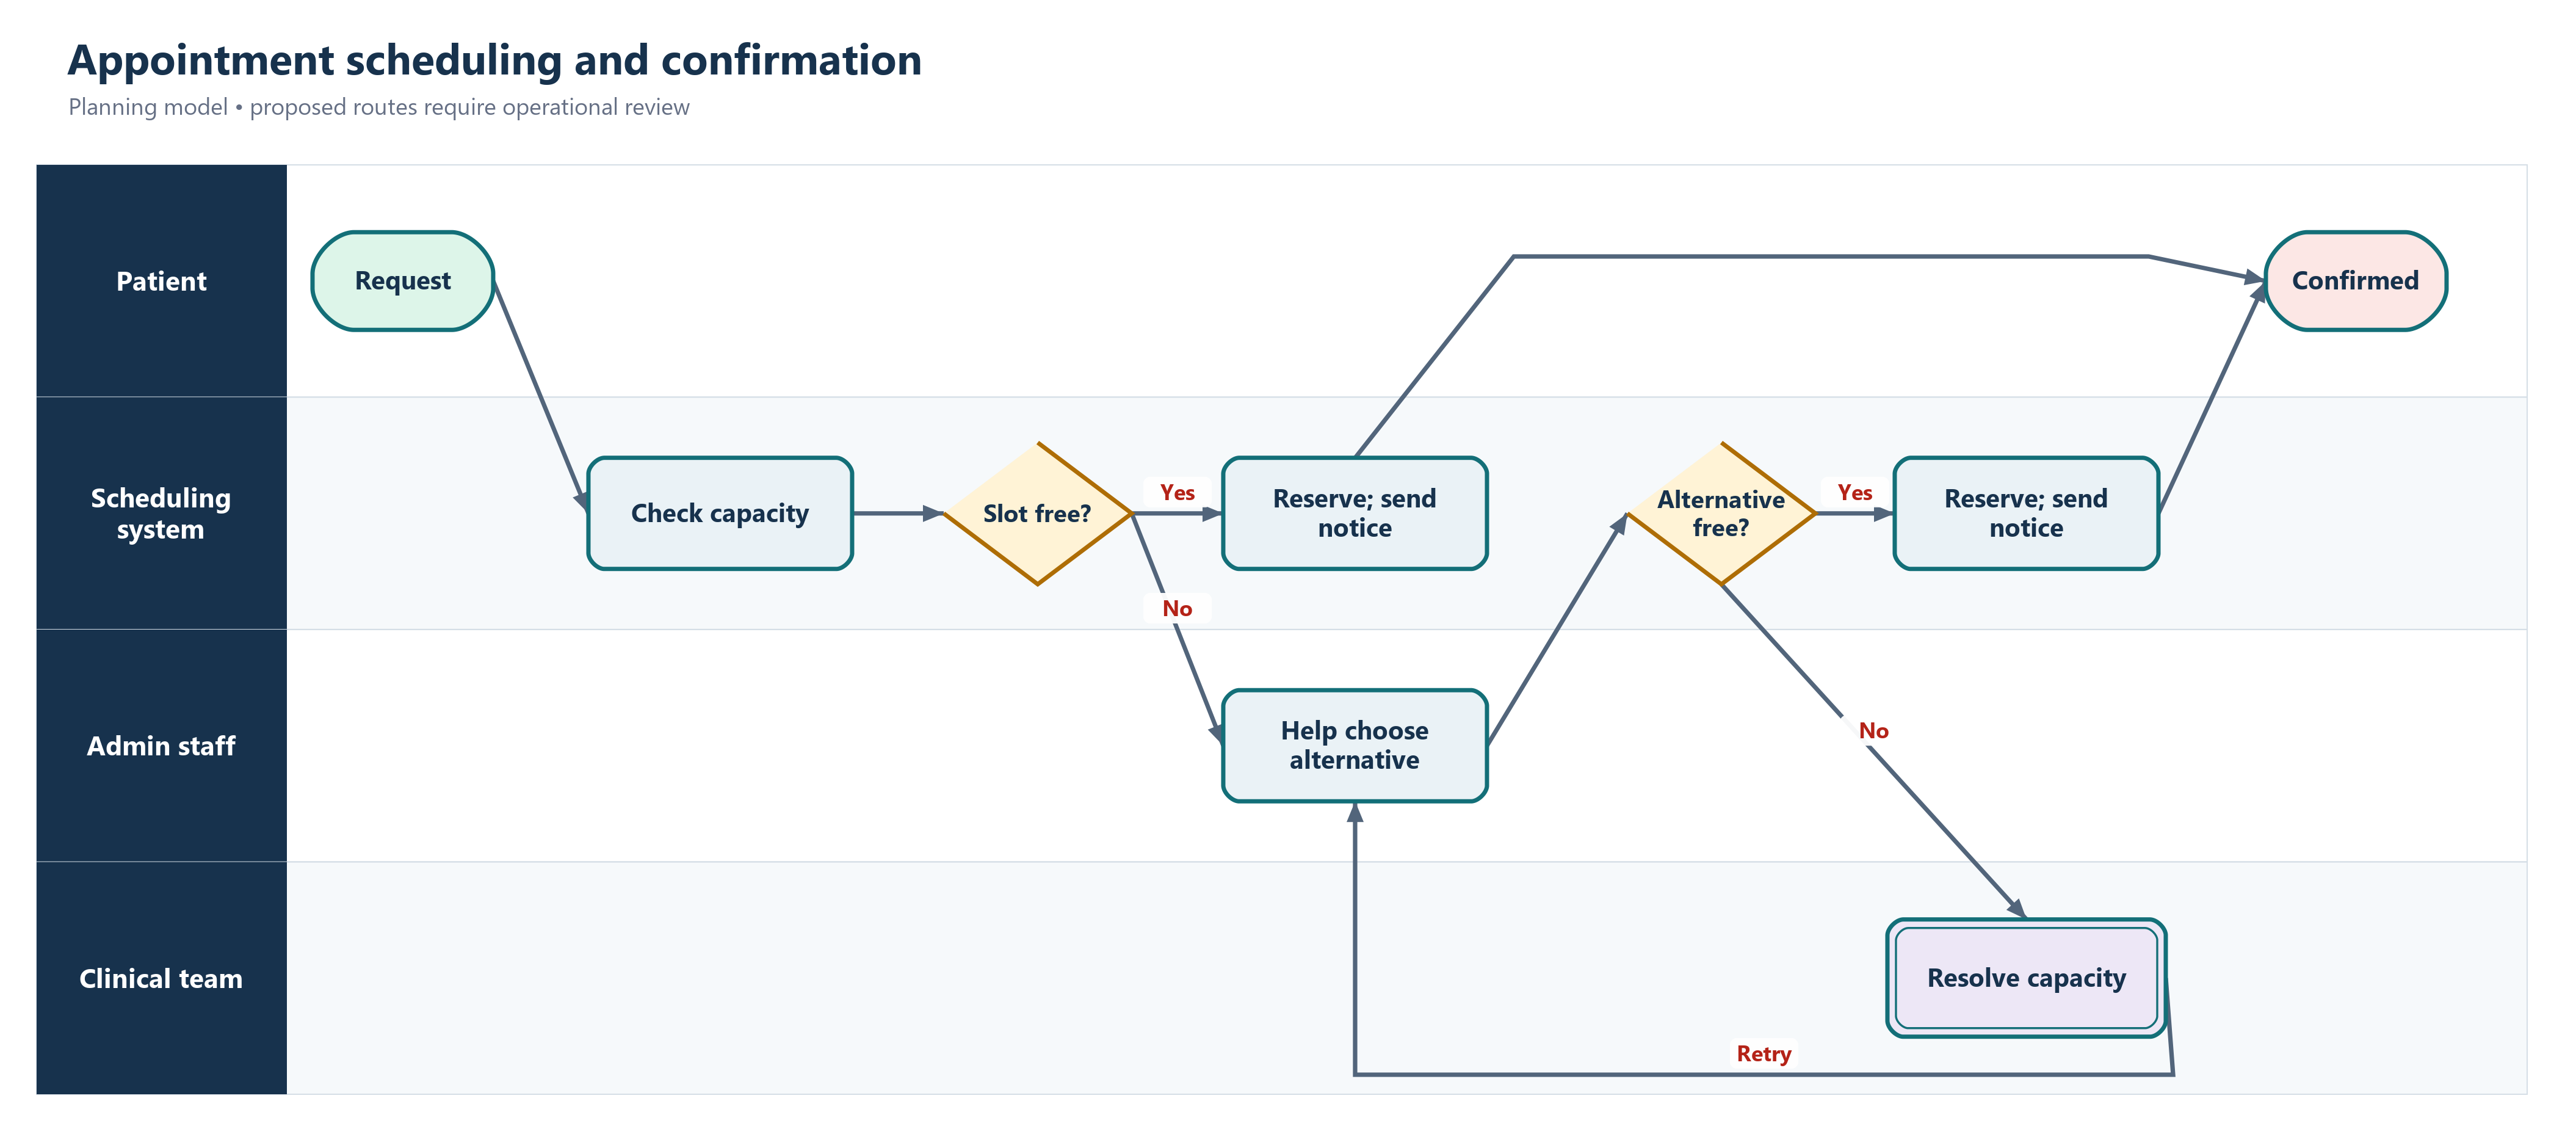
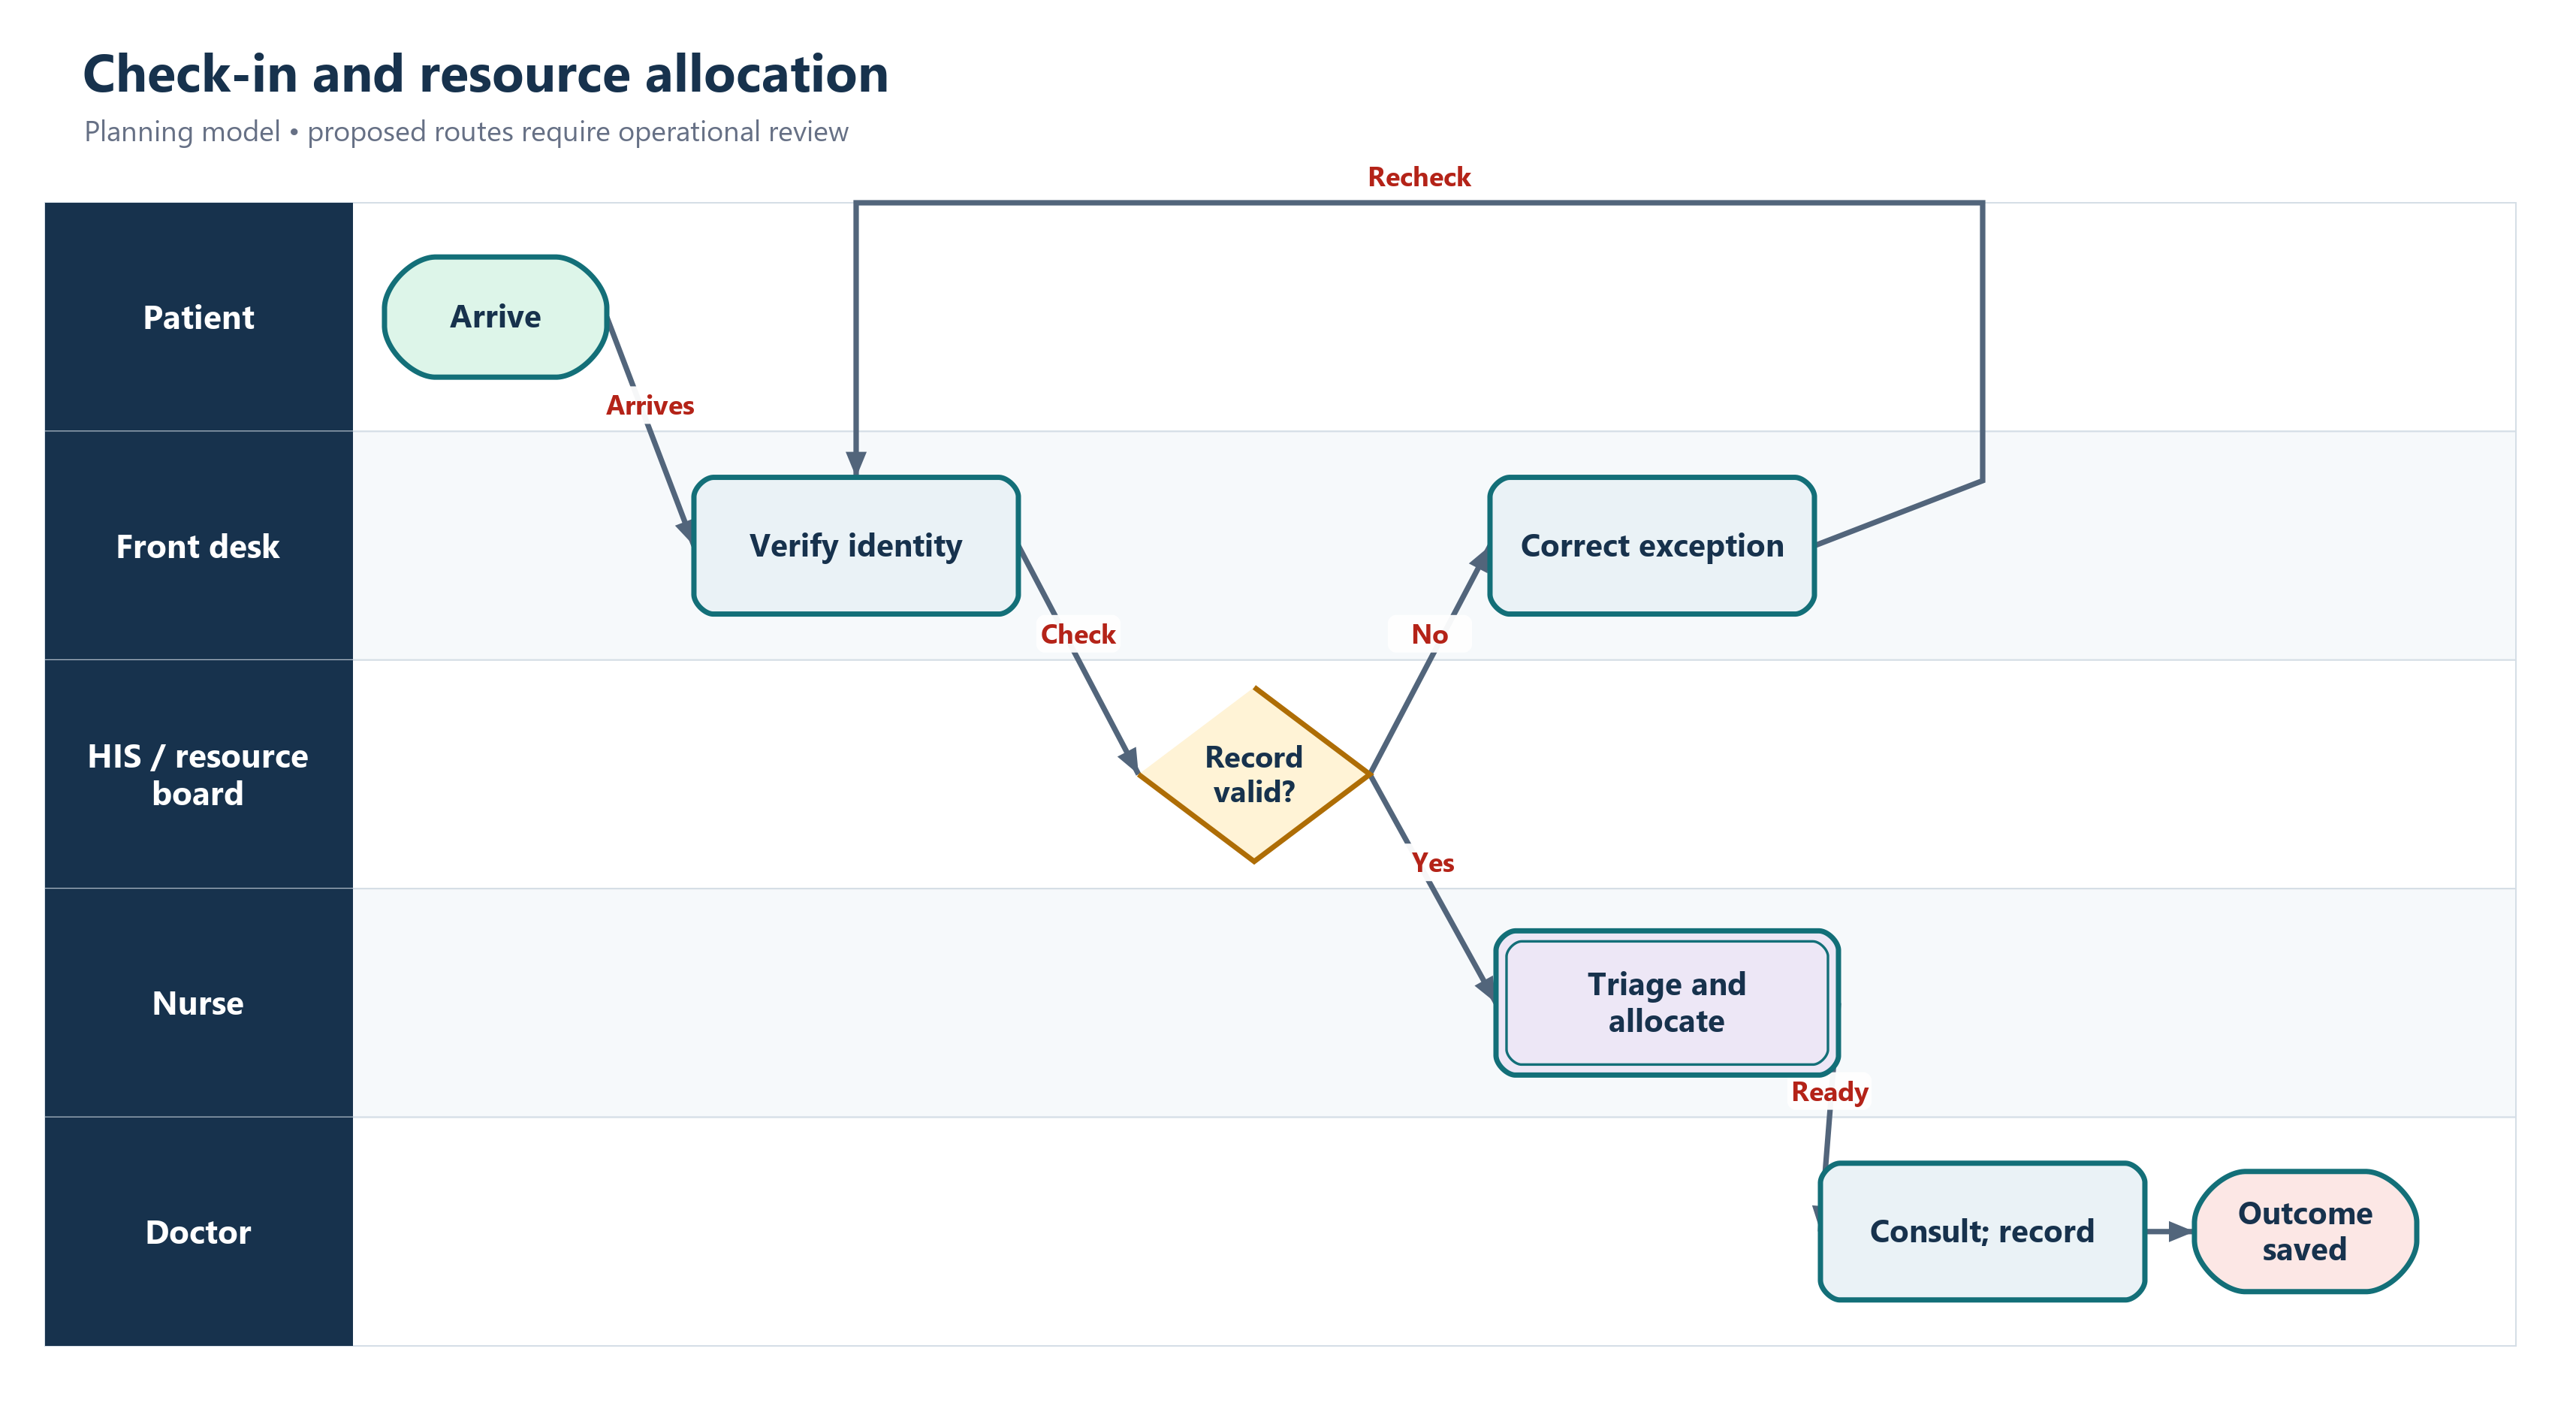
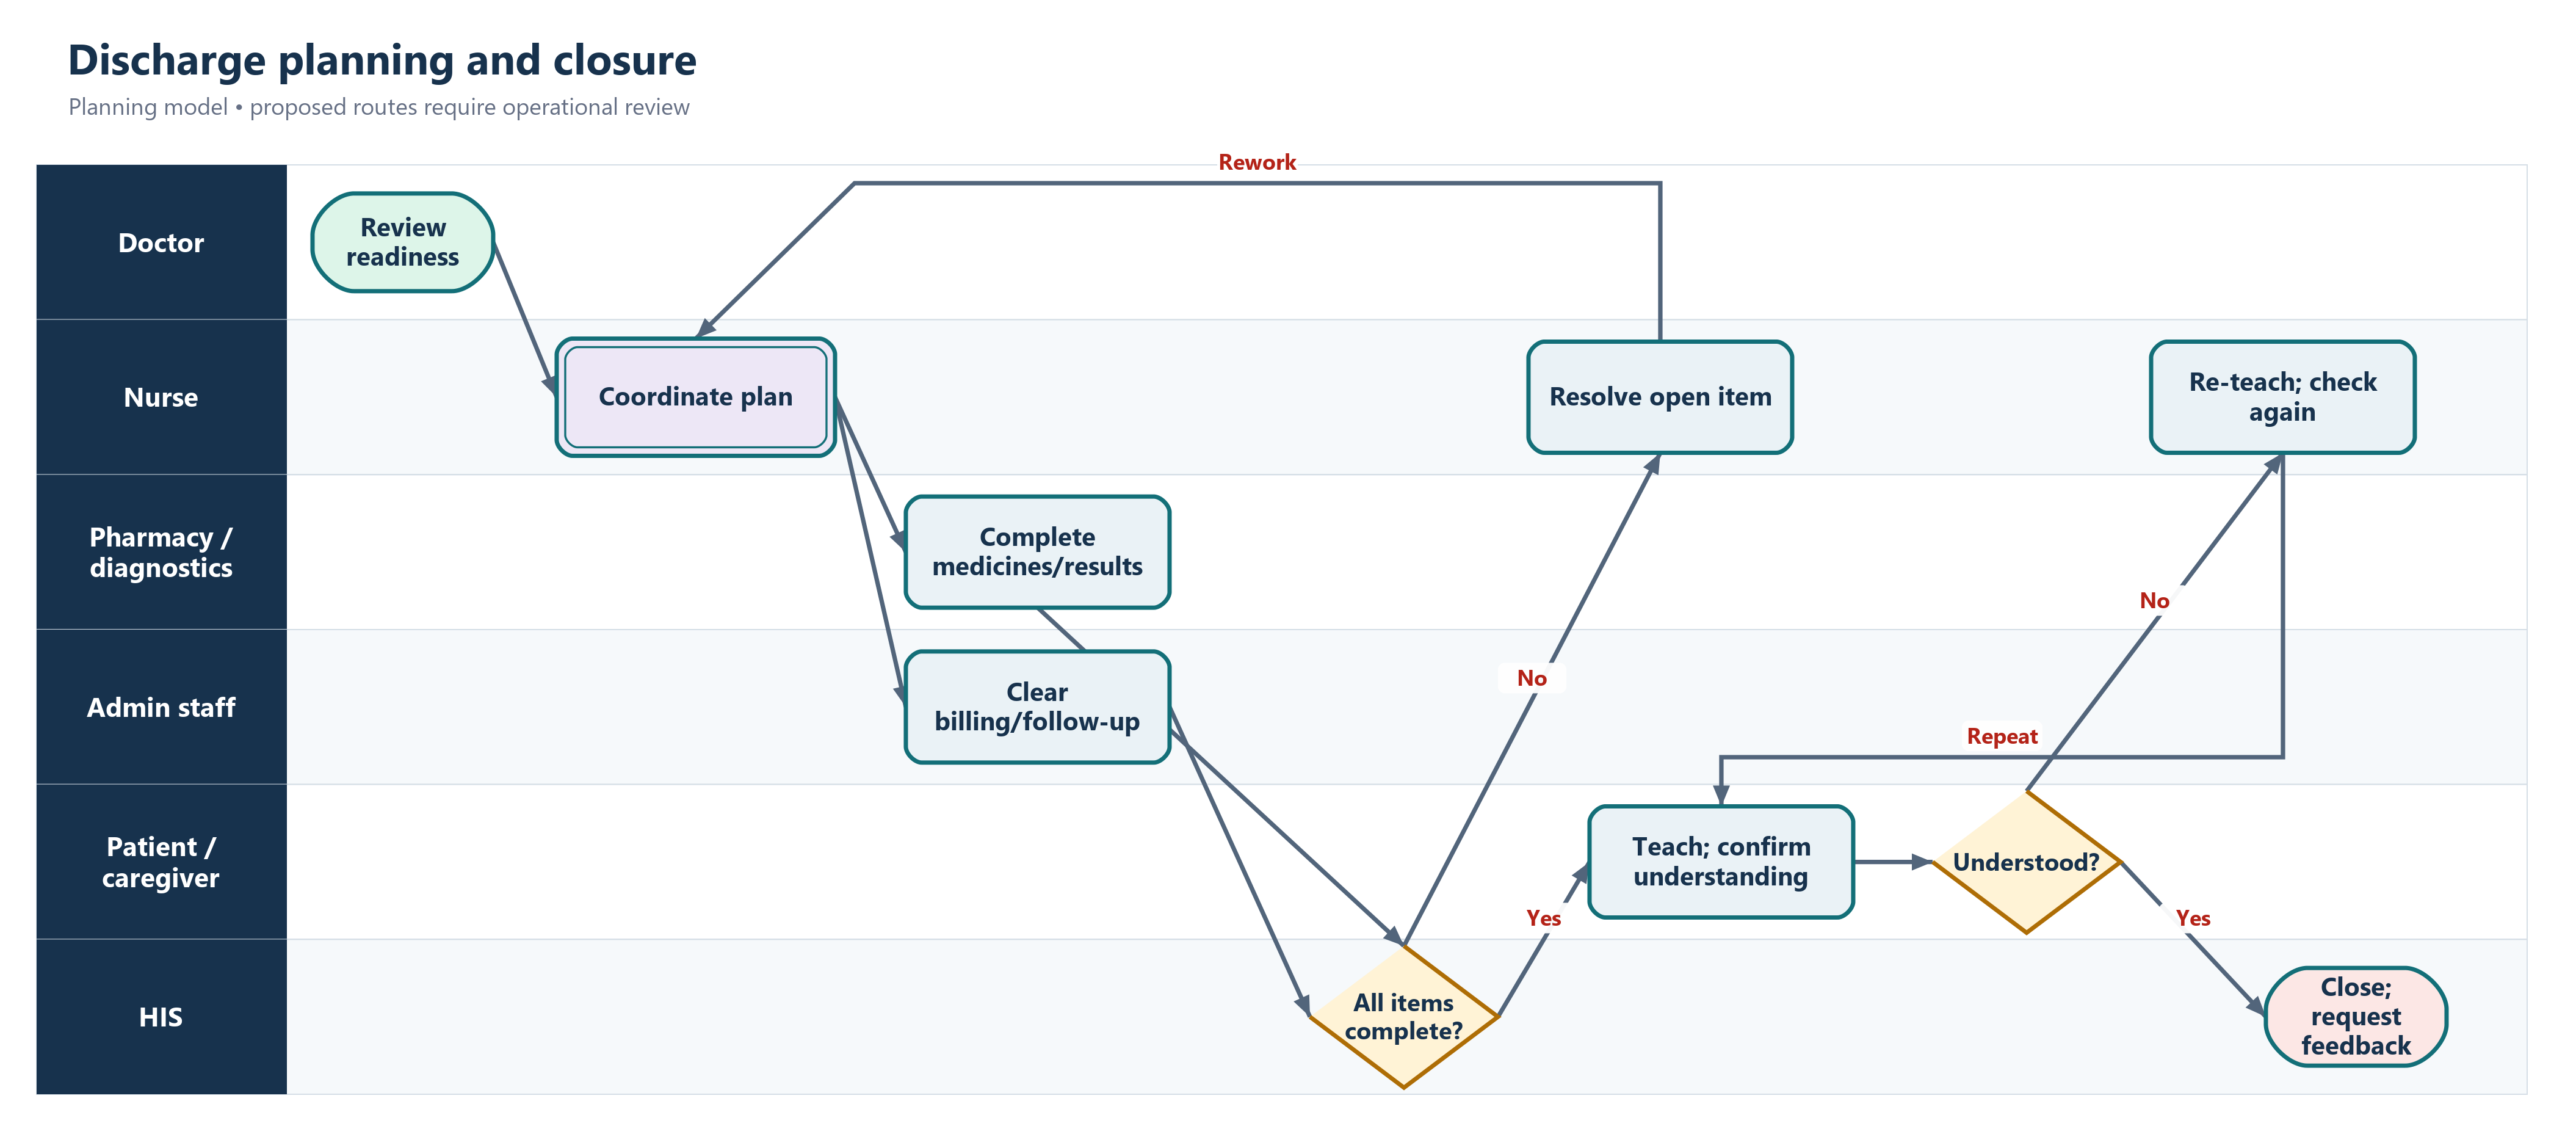
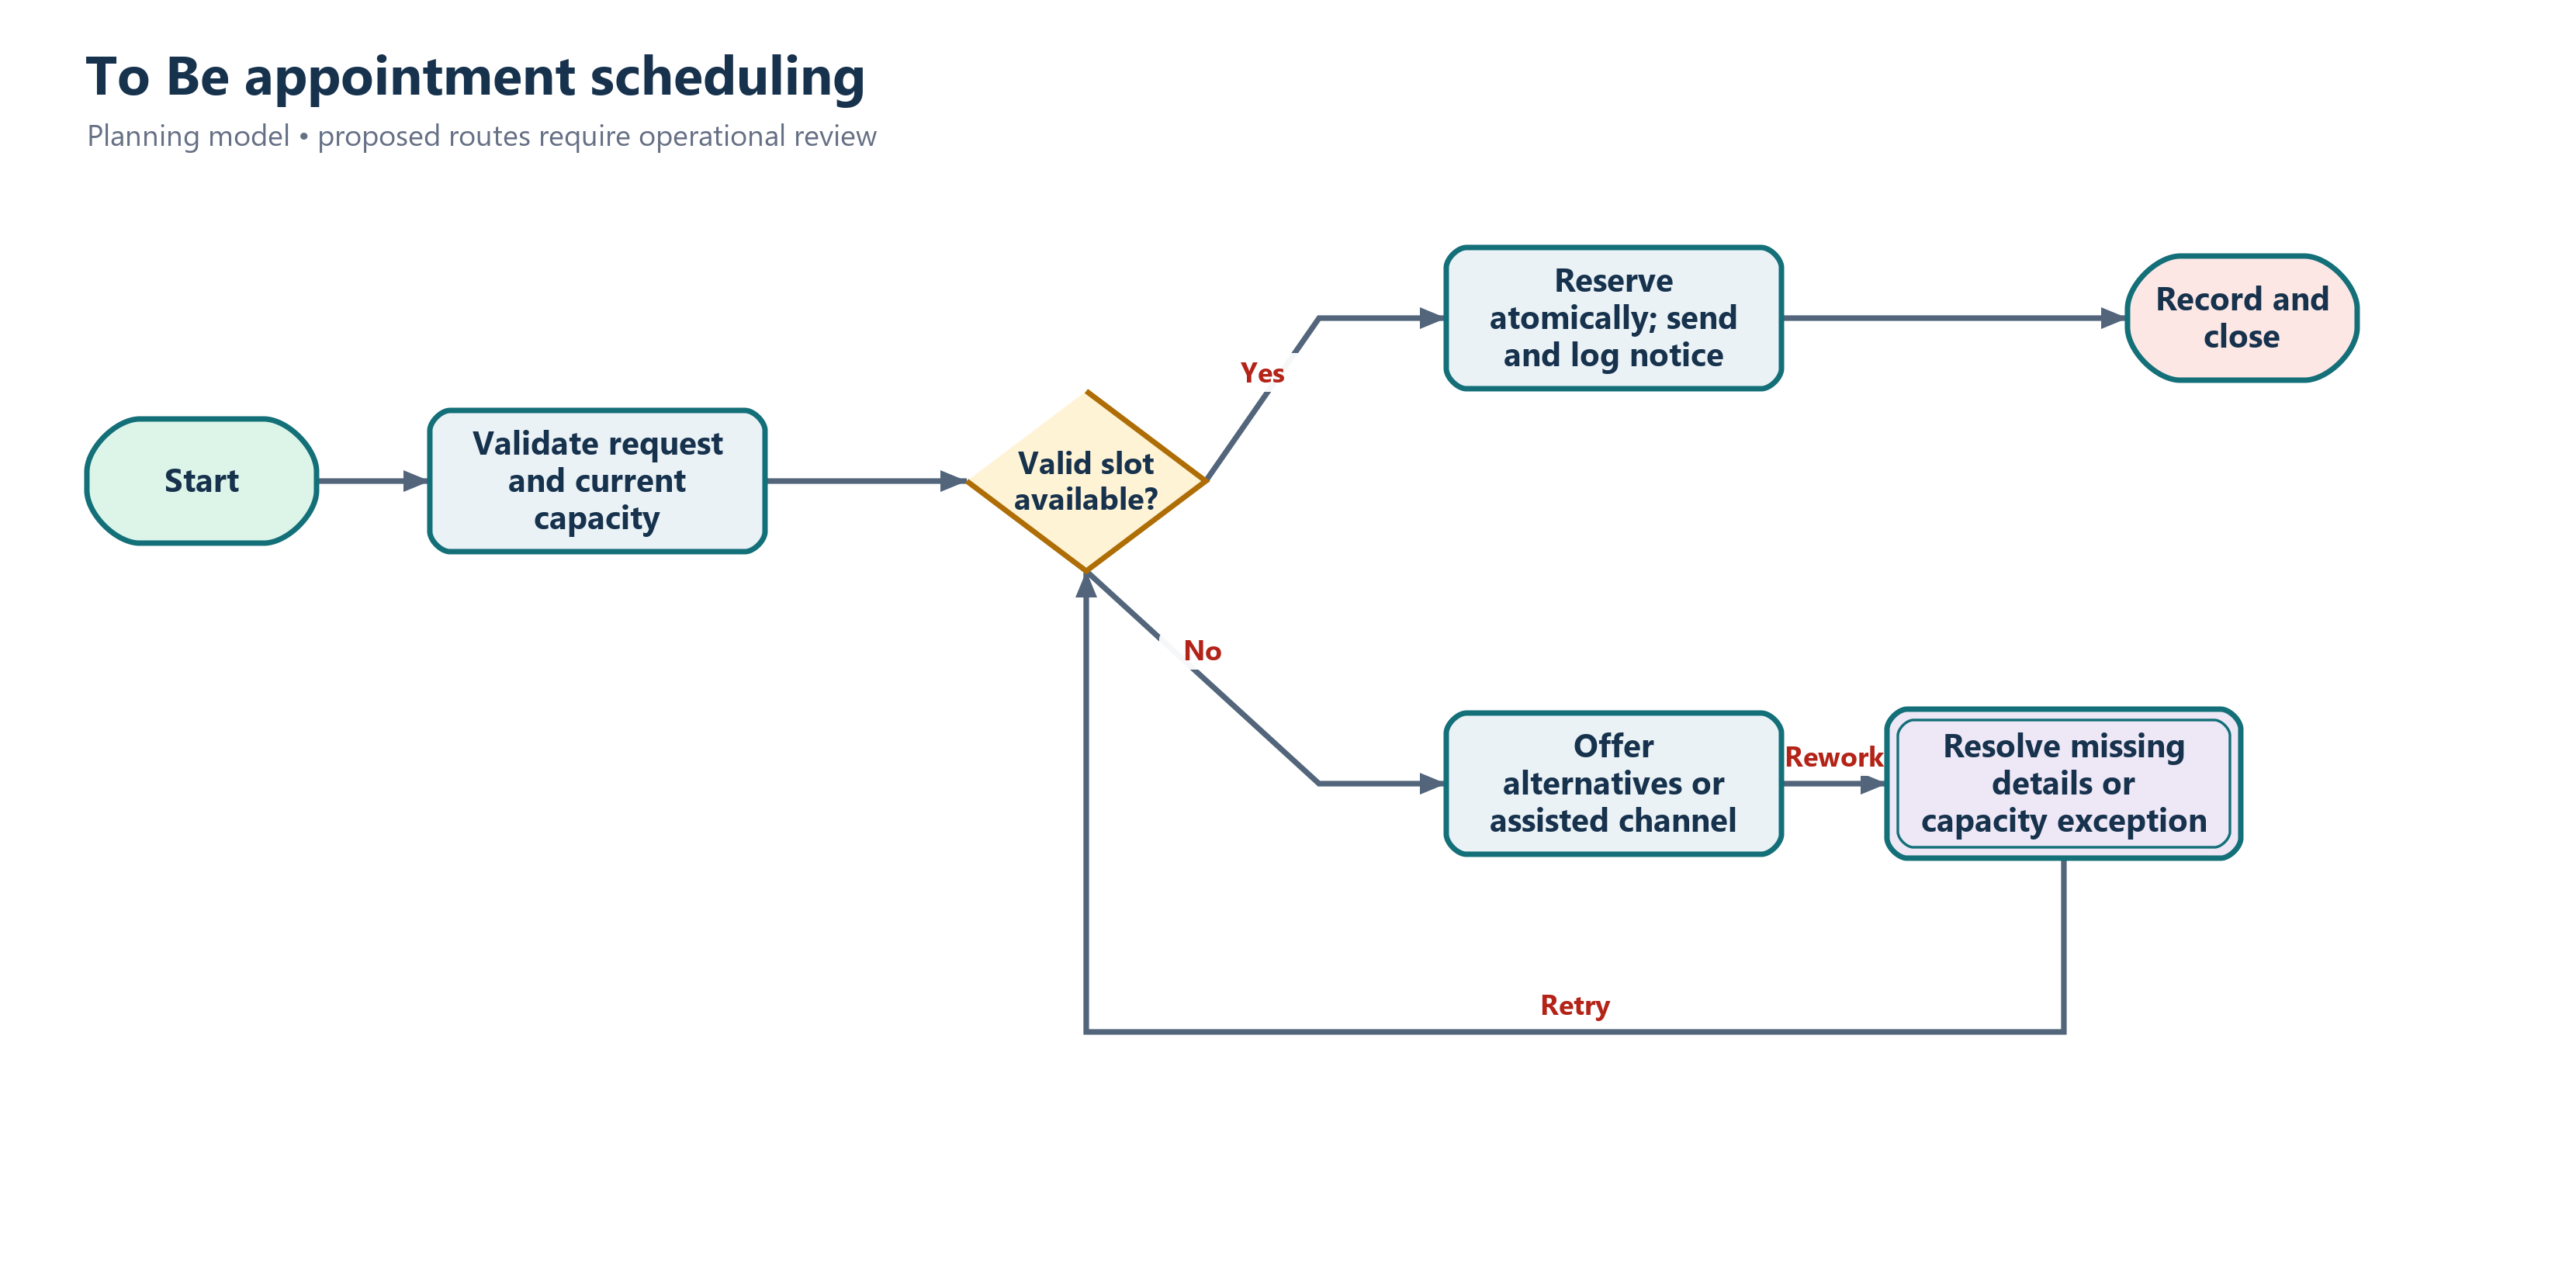
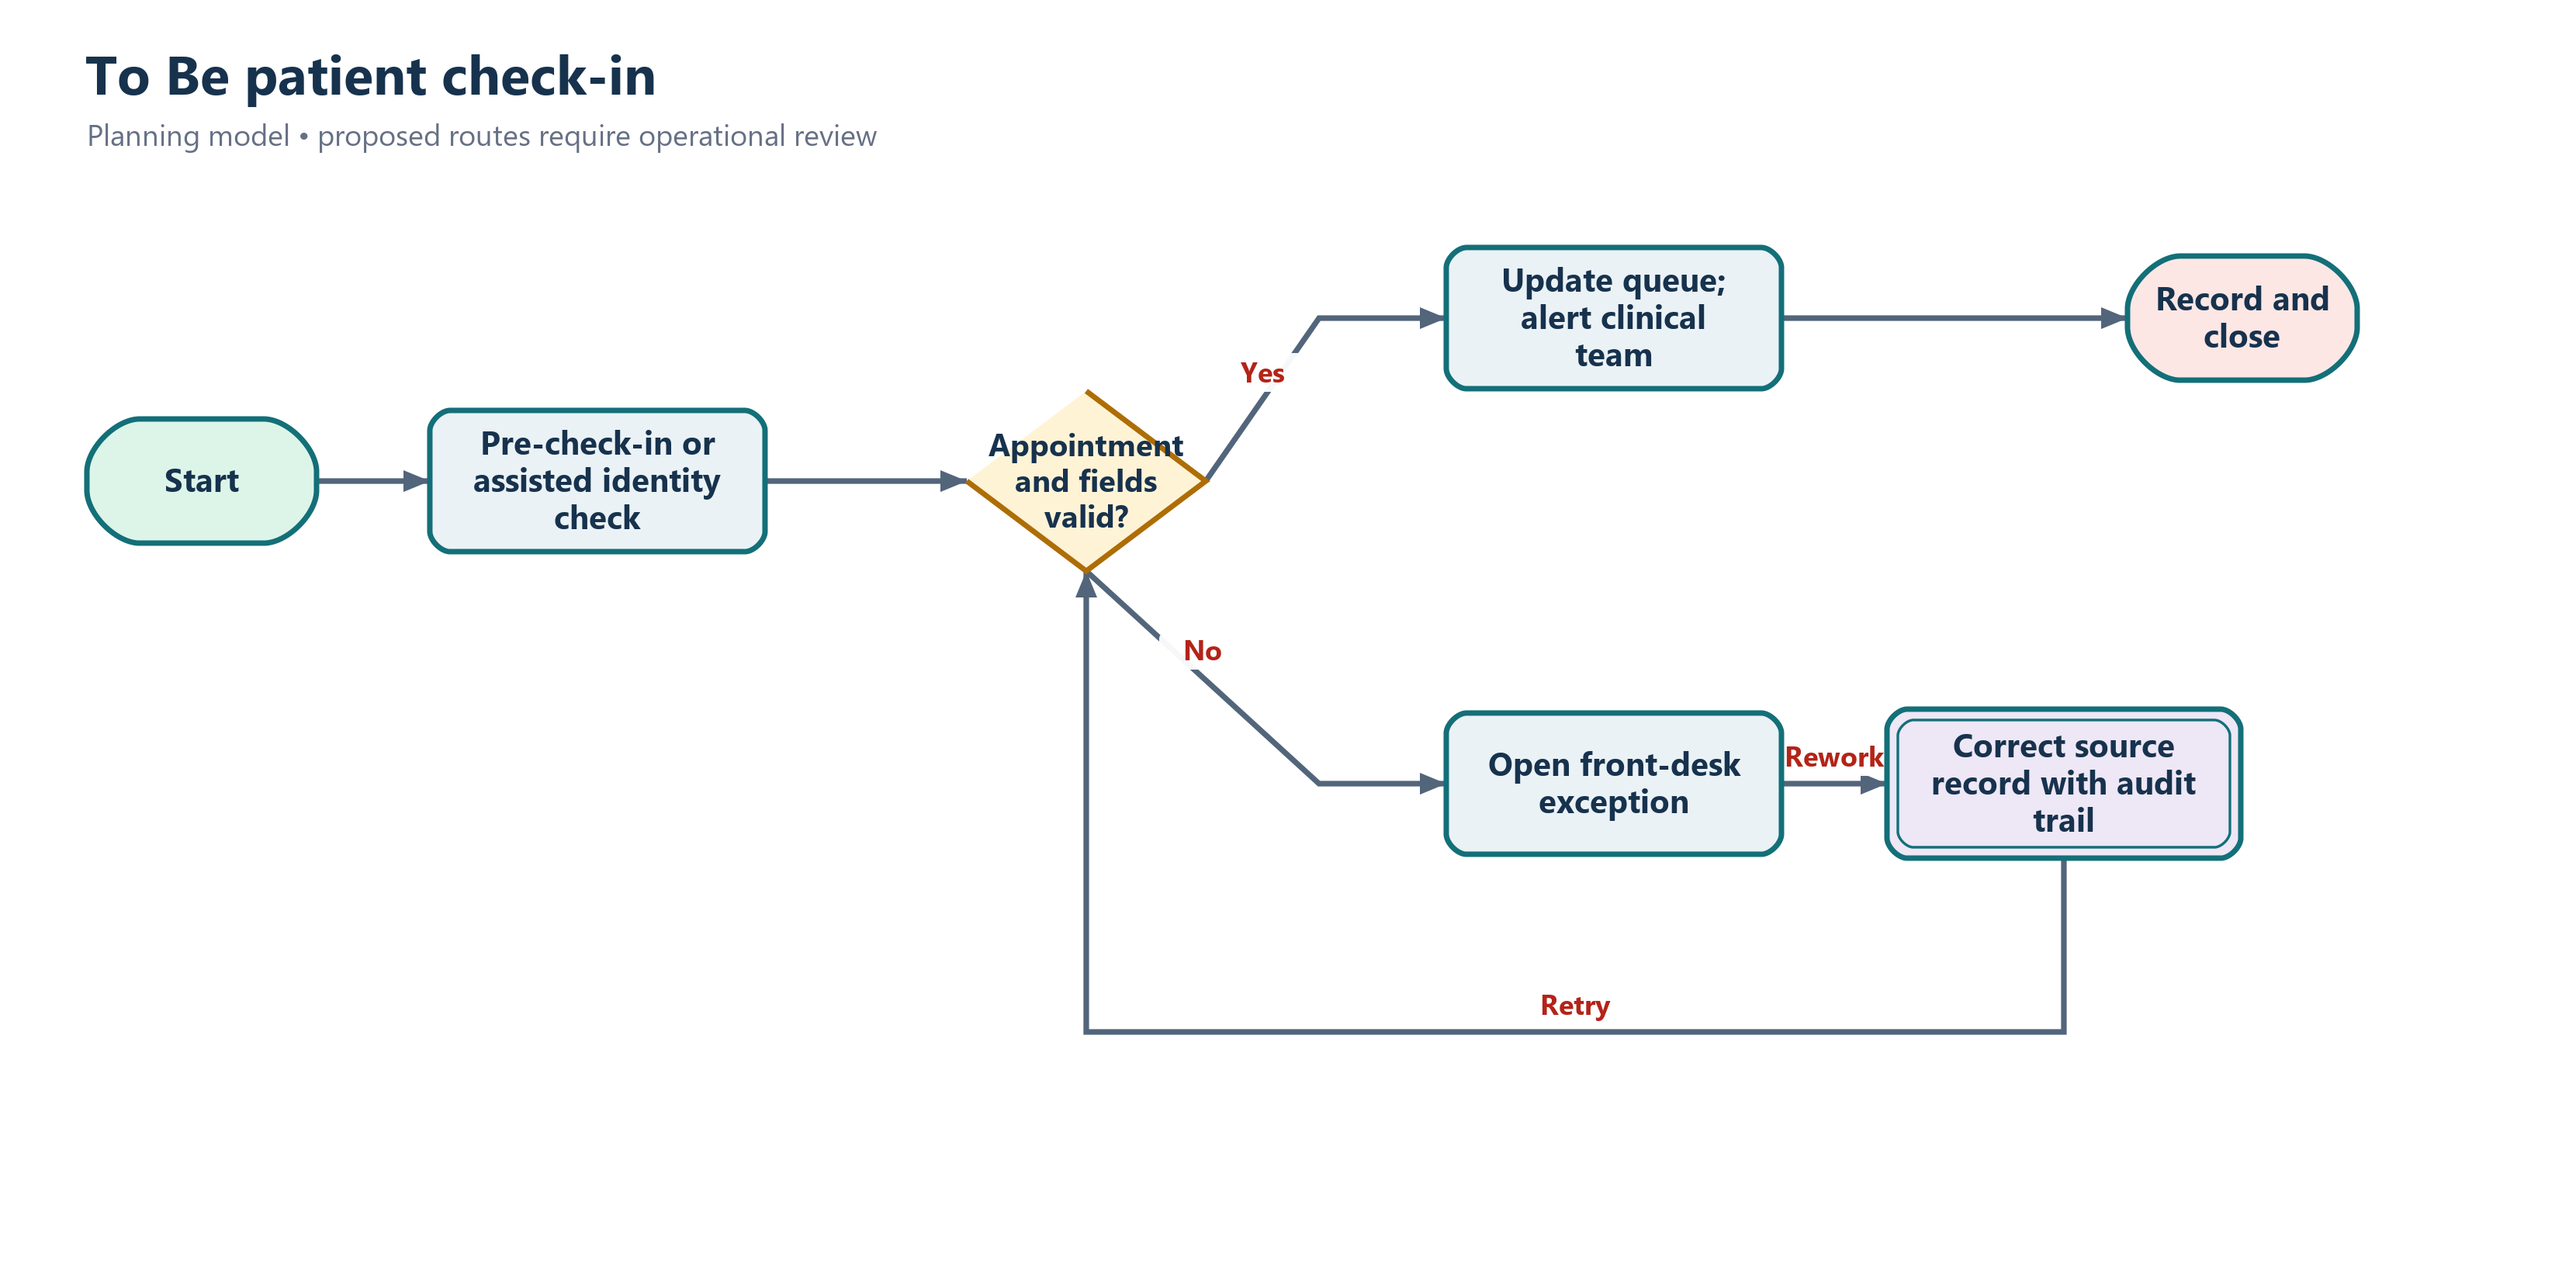
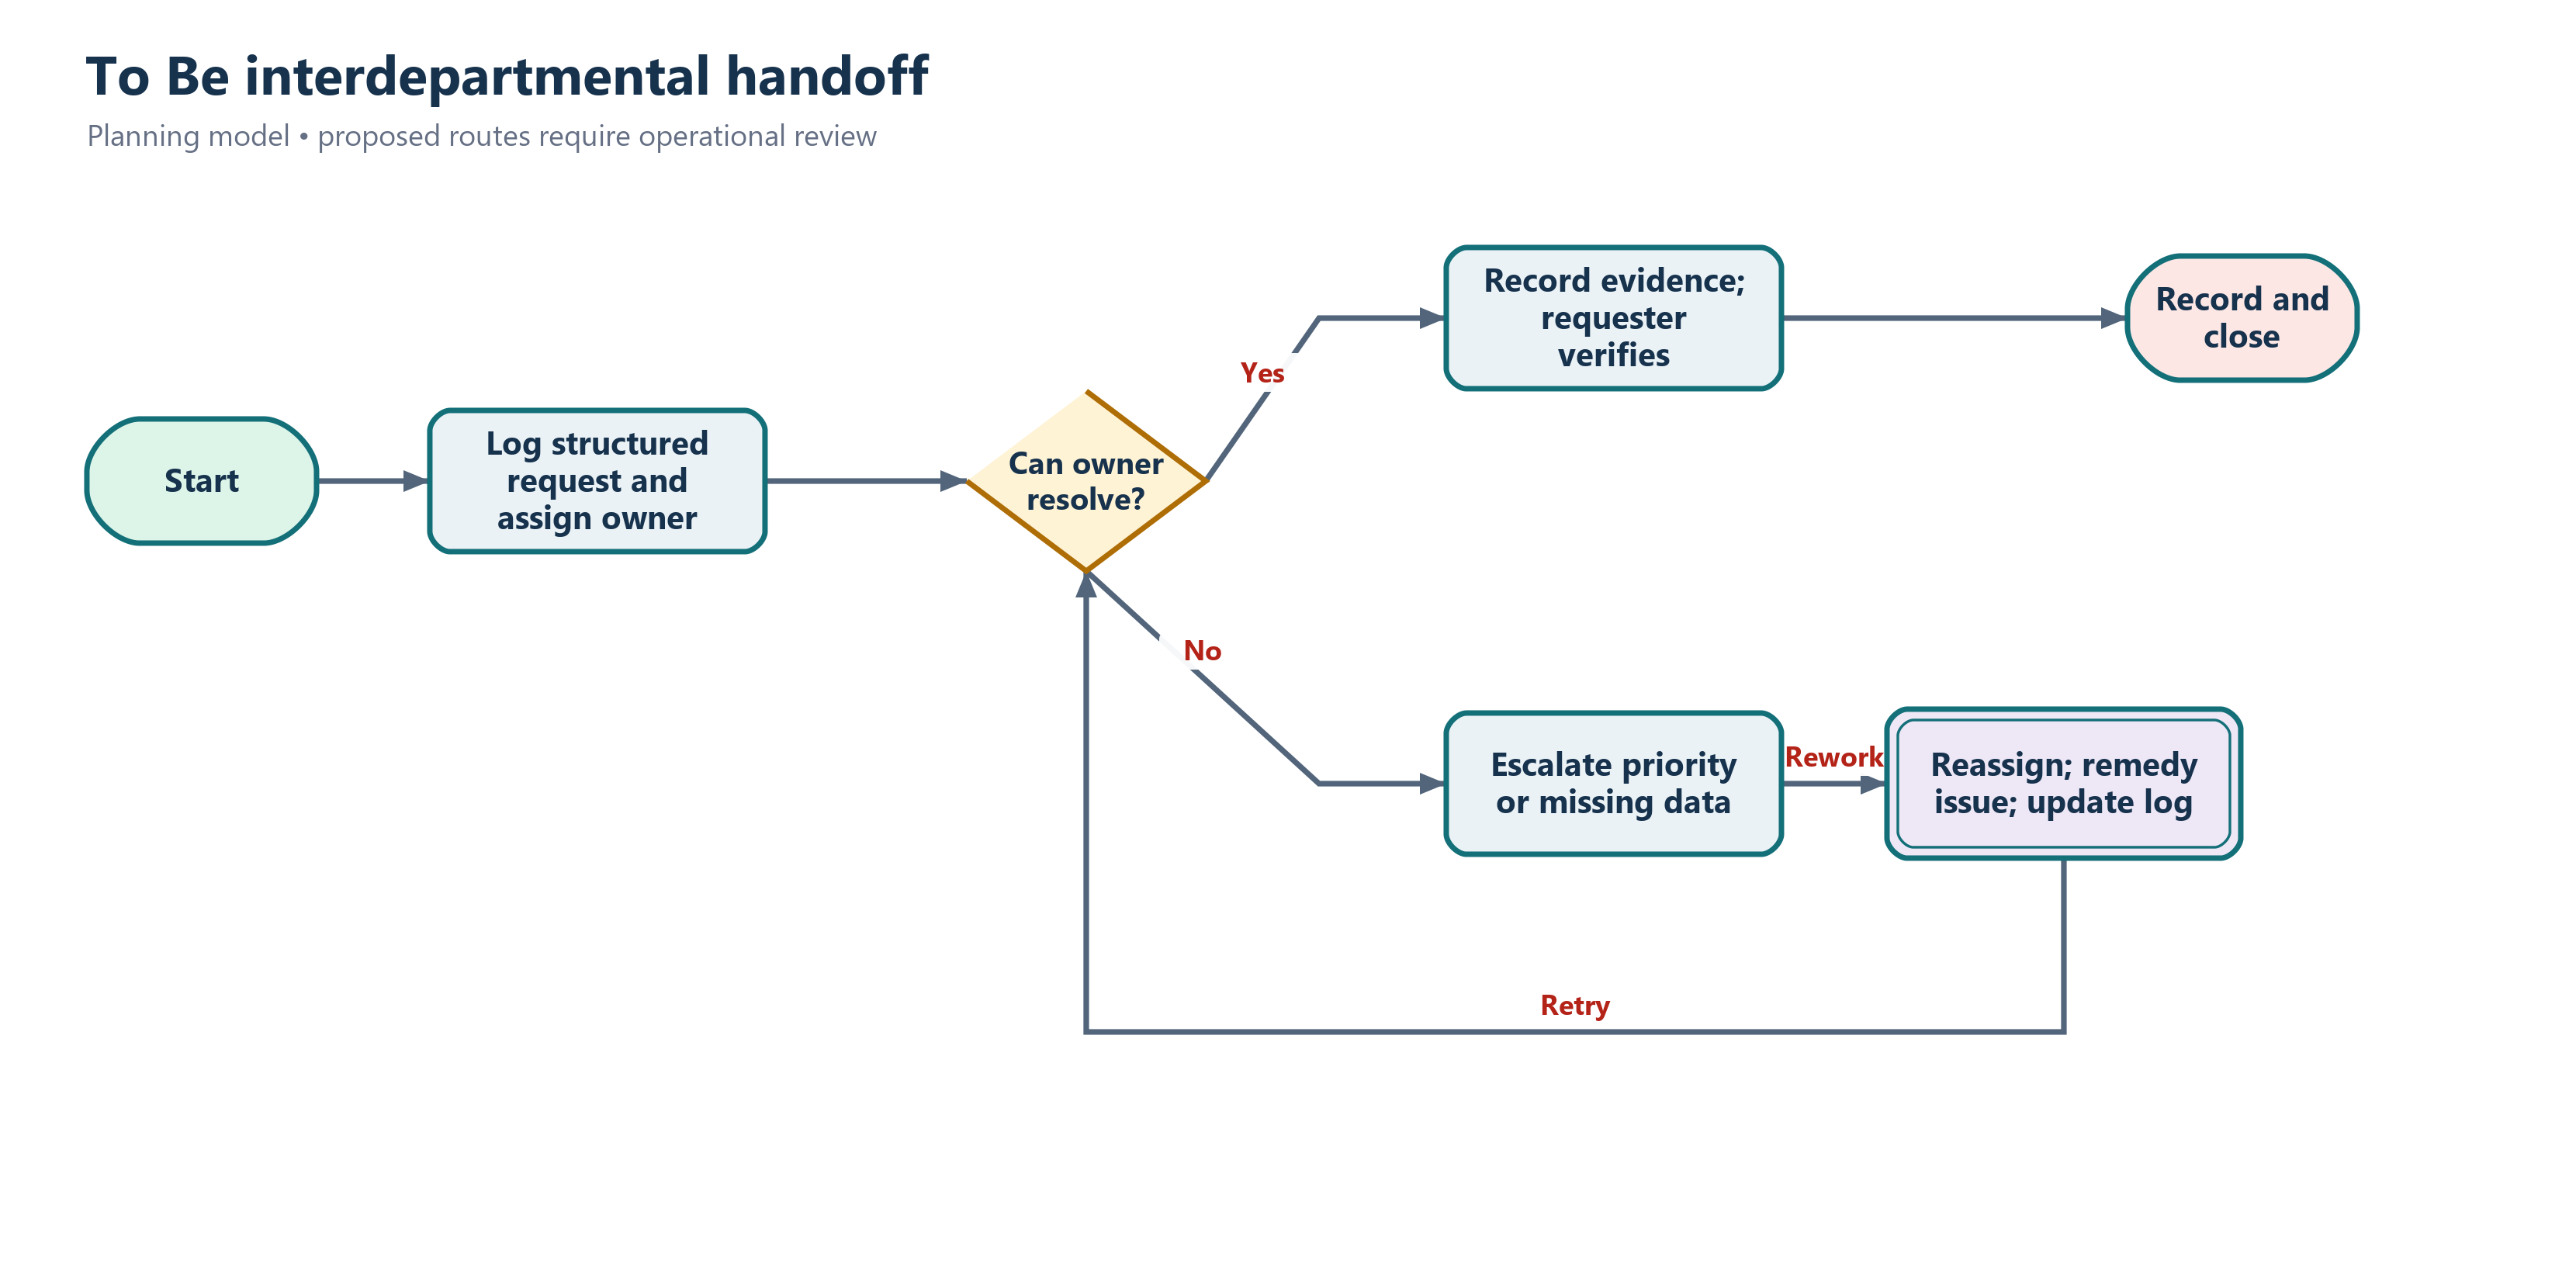
Editable SVG diagrams show current and proposed workflows, role lanes, decisions and rework. They are local diagrams; the specified Lucidchart/Visio tooling and formal BPMN conformance remain separate requirements.
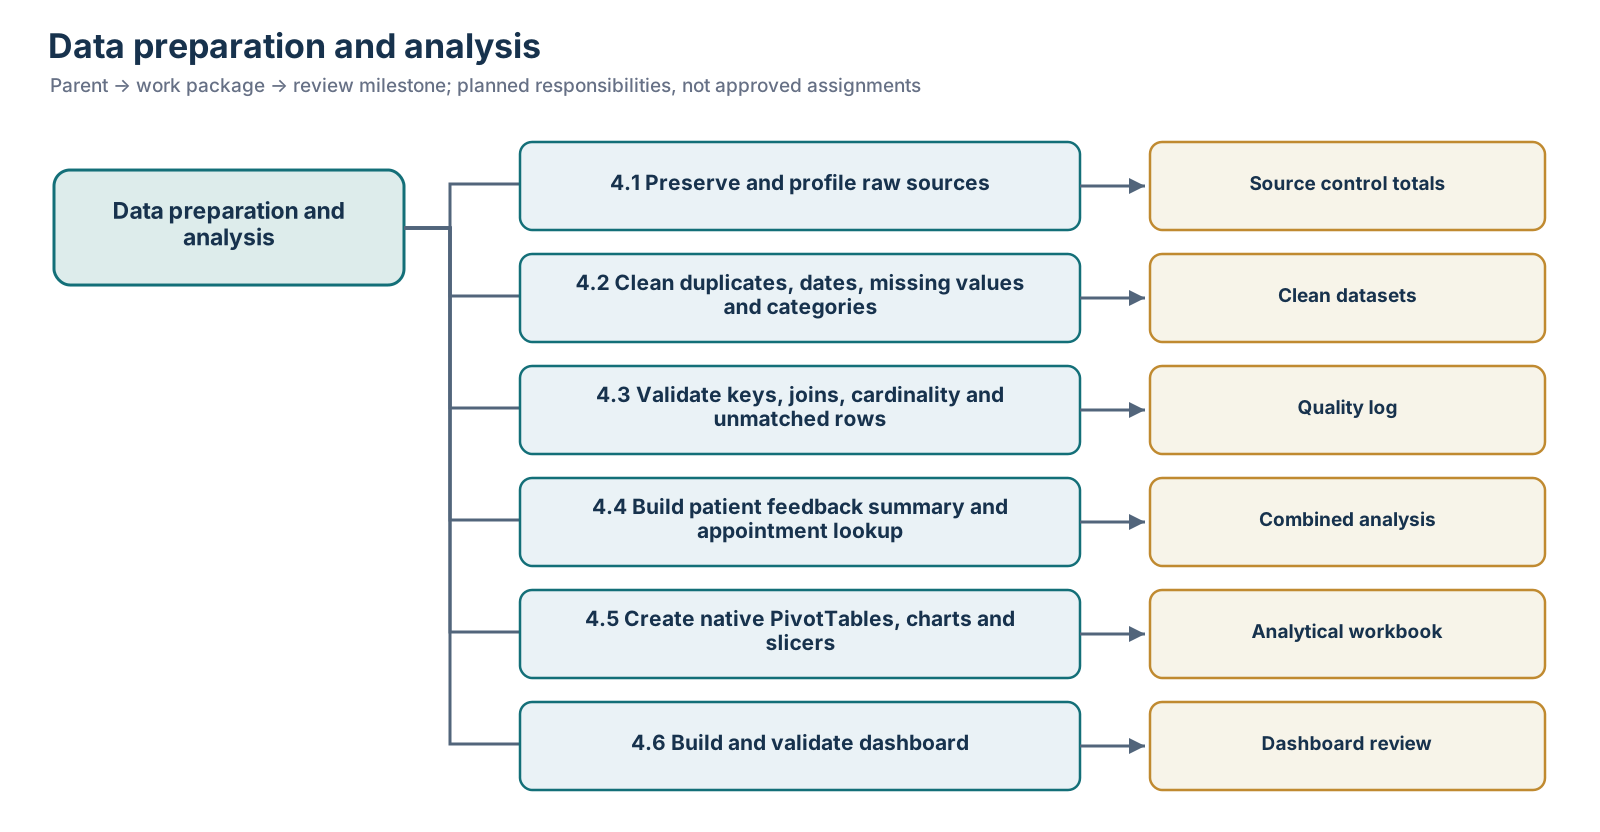
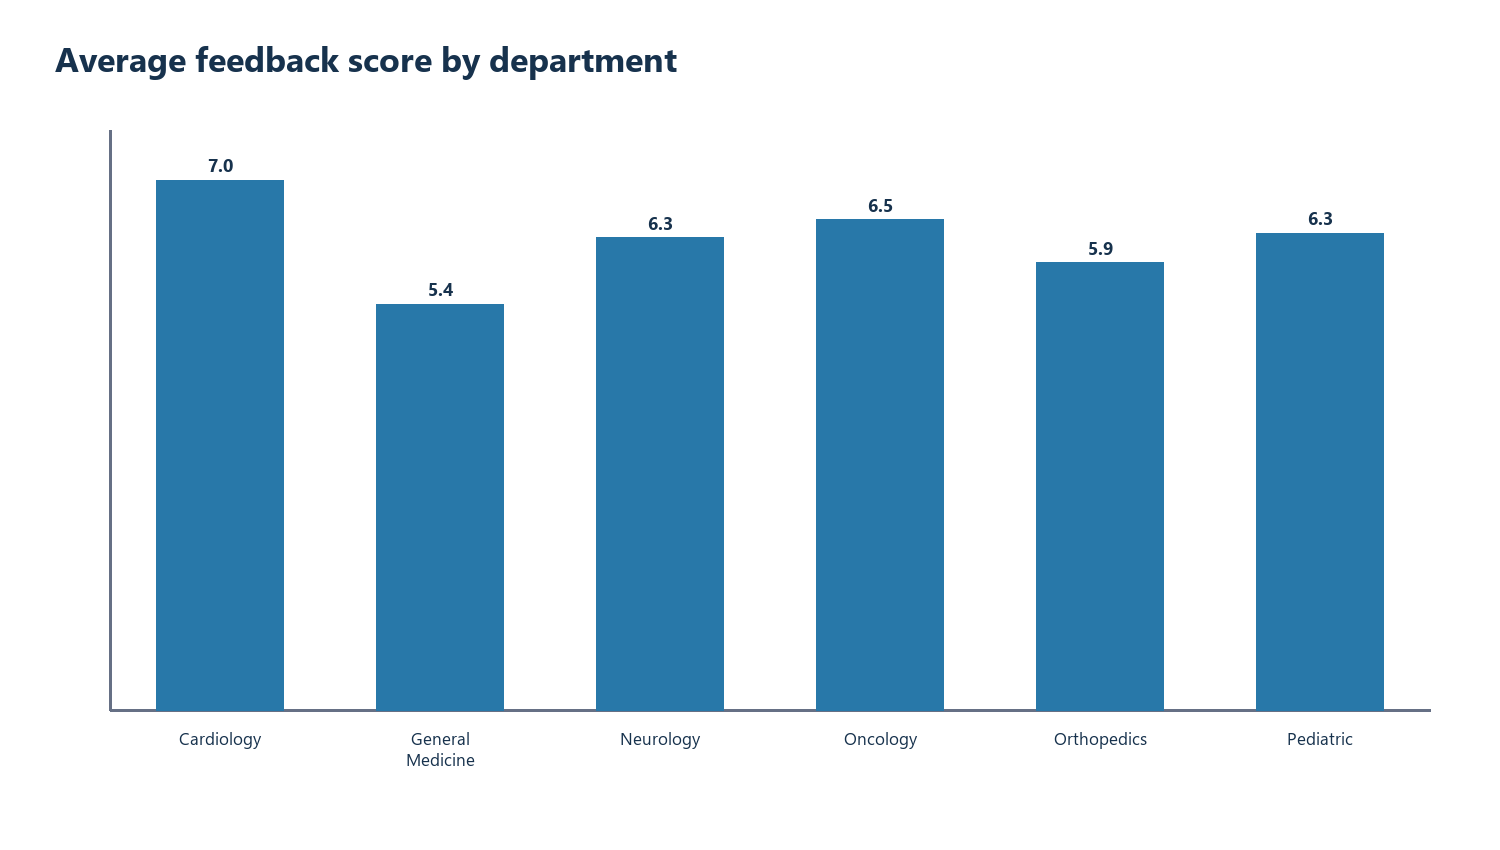
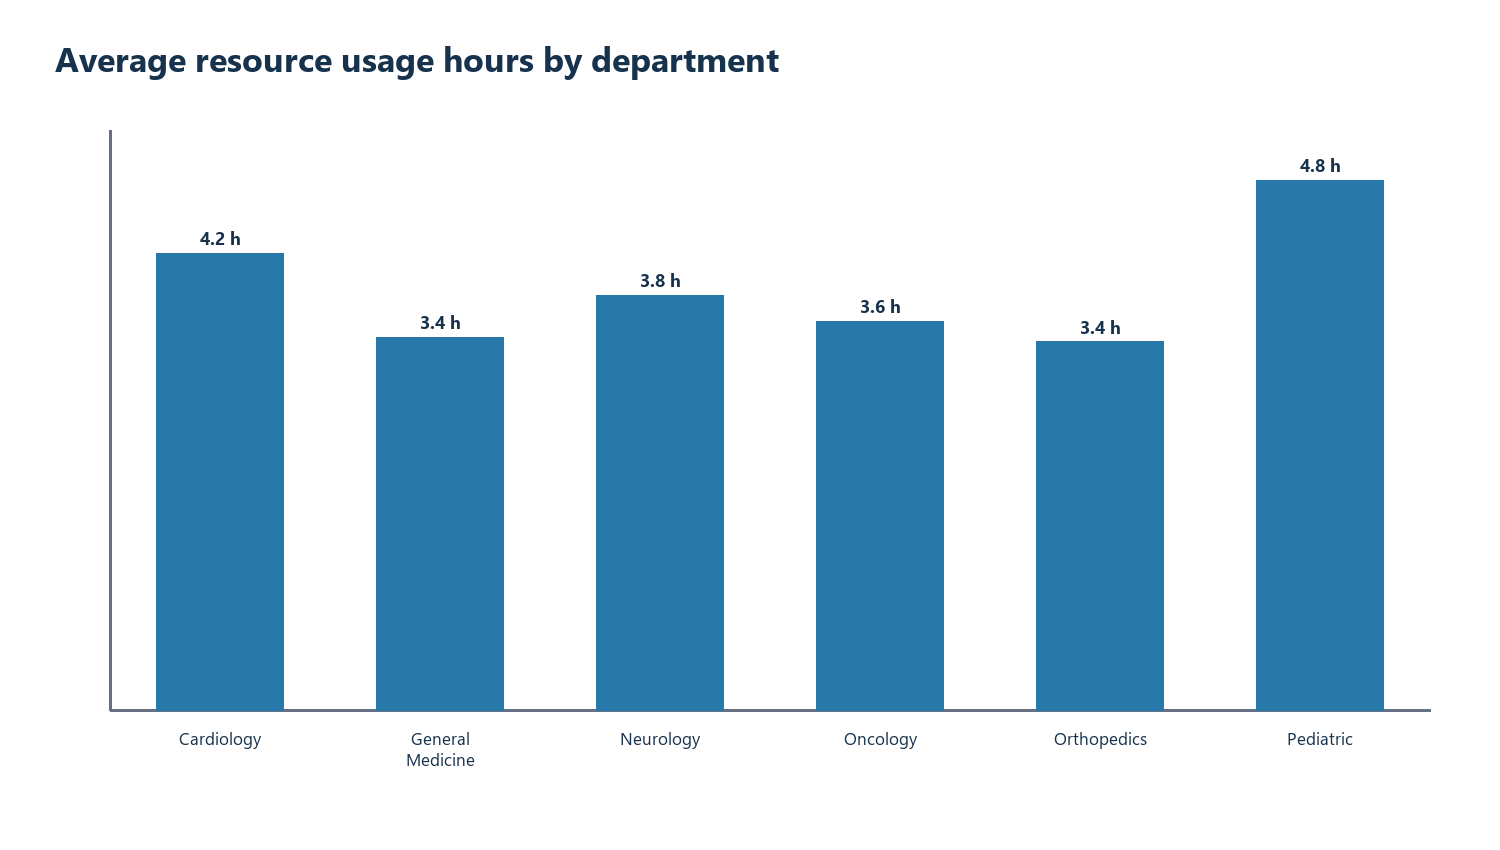
The analysis uses 200 appointment records, 198 substantive feedback records and 200 resource records. Six missing feedback scores were imputed using the mean 6.270833. Department-level resource comparisons support descriptive analysis rather than patient-level causal claims.
The analysis workbook contains four native Excel PivotTables, six slicers and four charts. The dashboard has four native pivots, six slicers and two charts. Desktop Excel checks found no formula errors or external connections. Selecting Cardiology changed the appointment KPI from 200 to 38 and updated the chart series; resetting restored both.
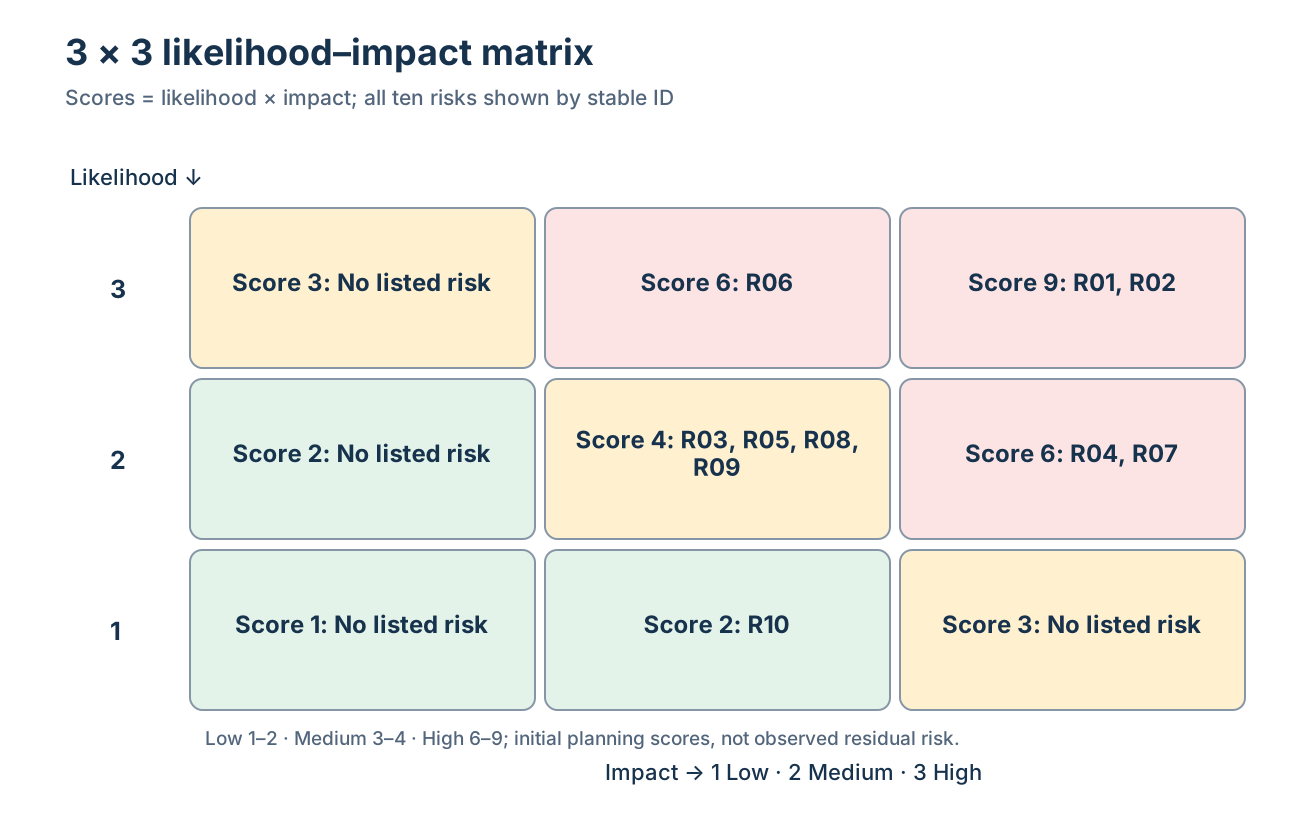
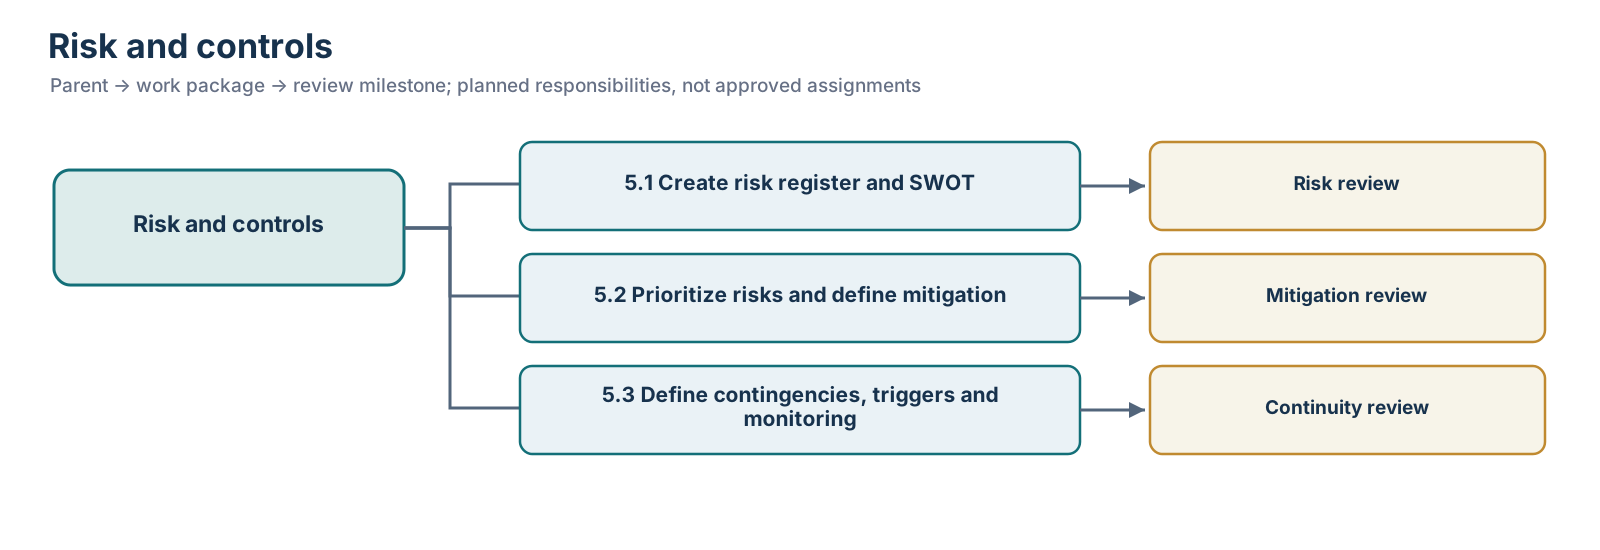
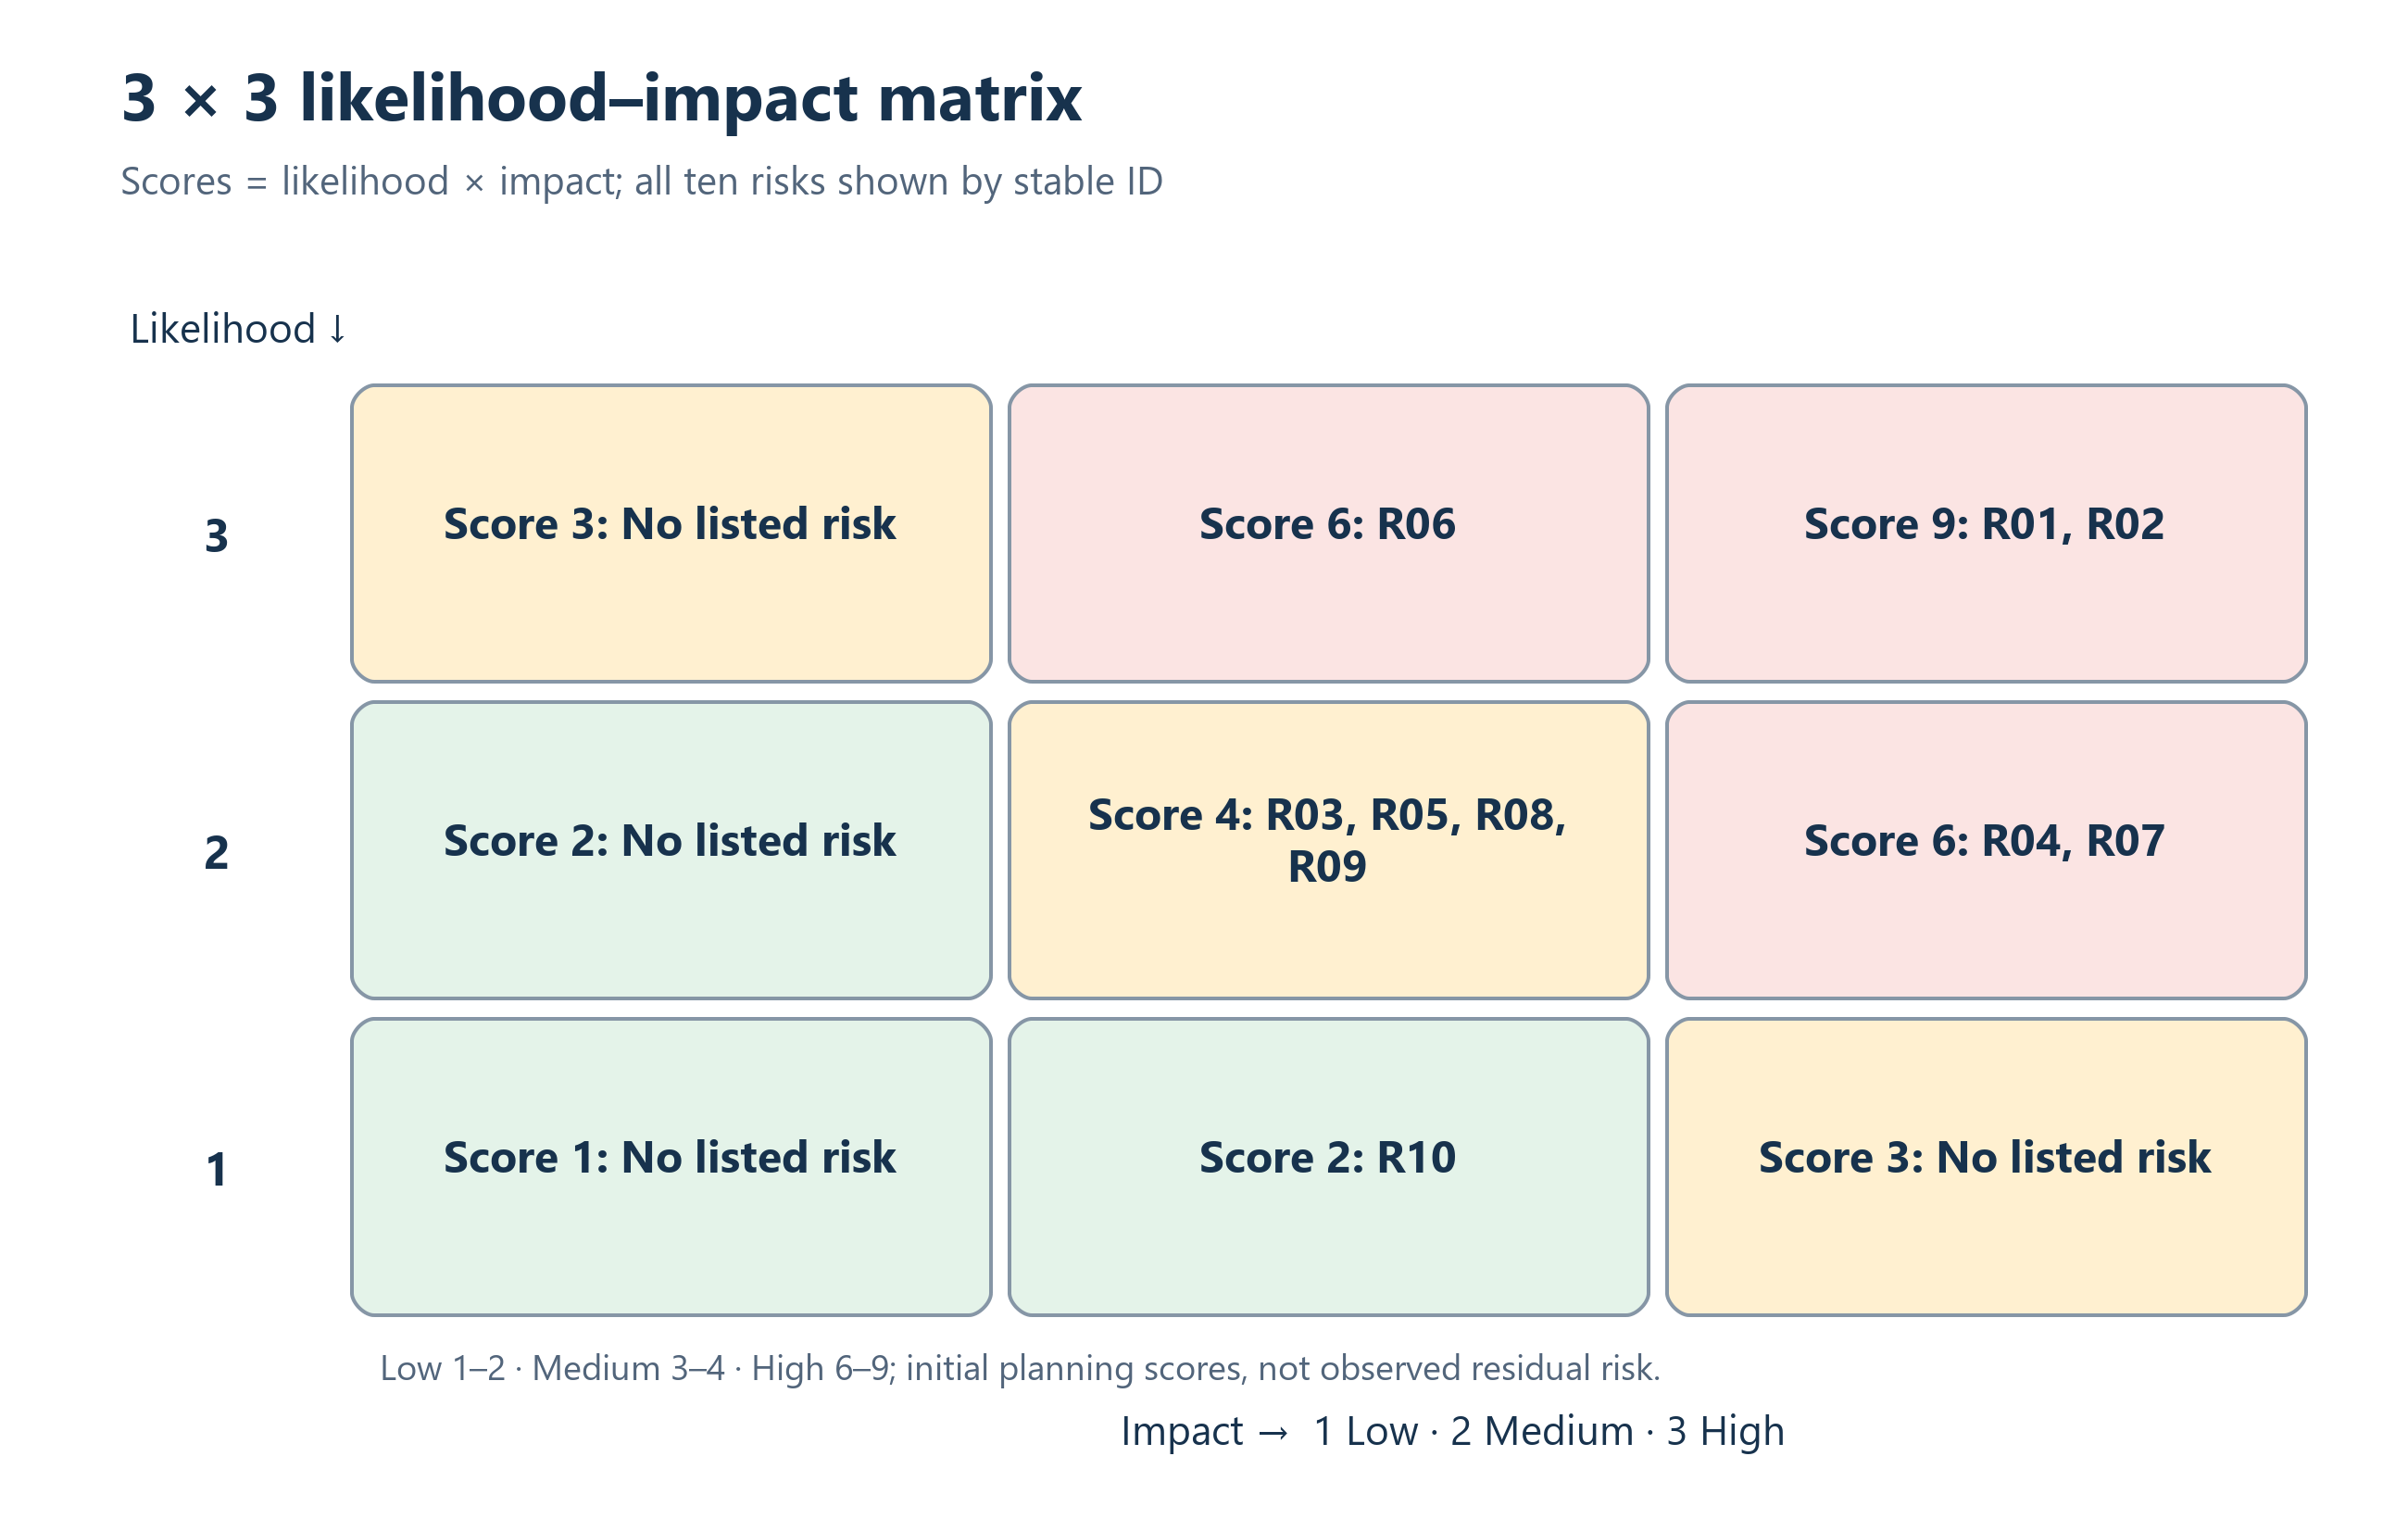
The risk register and SWOT identify ten risks with likelihood/impact scores, controls, owners, triggers and contingencies. The dynamic 3×3 matrix recalculated when R01's likelihood was changed.
- Microsoft Excel
- PivotTables and slicers
- Requirements traceability
- Stakeholder and scope analysis
- Editable SVG process models
- Risk analysis
- Python pandas and NumPy
Nine labs and their current status
1. Requirements and RTM
Local complete; review open
BRD, requirements traceability workbook and findings report; 18 IDs and planned UAT.
2. Stakeholder analysis
Local complete; review open
Stakeholder matrix, analysis and engagement plan, with editable matrix diagram.
3. Scope and WBS
Local complete; review open
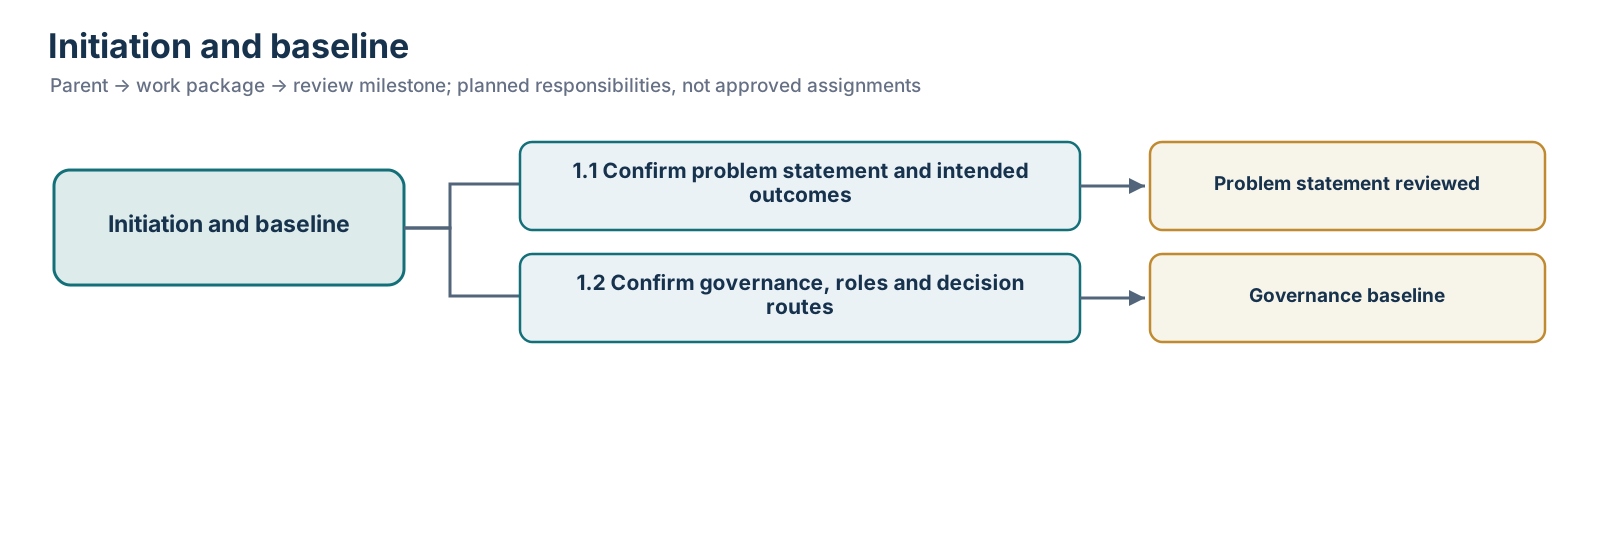
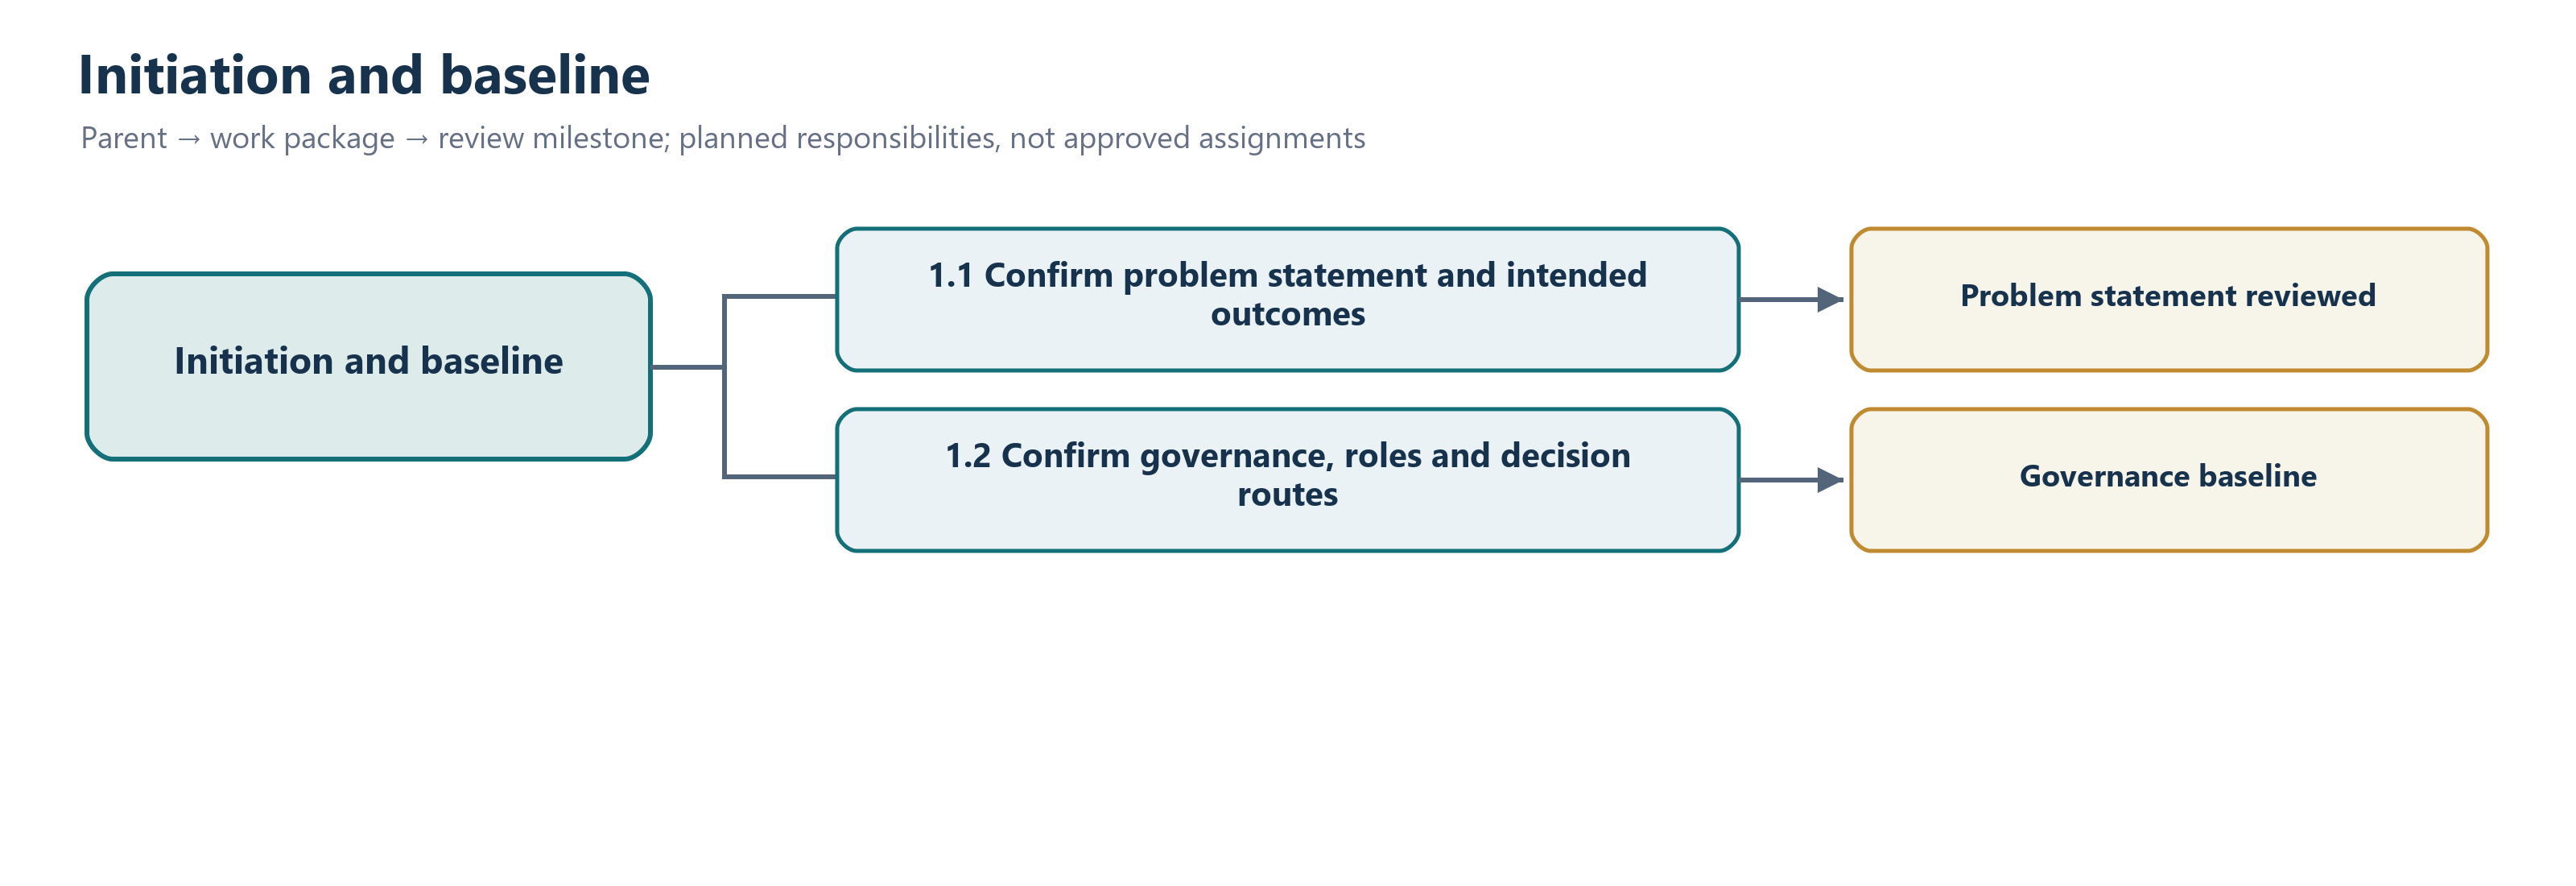
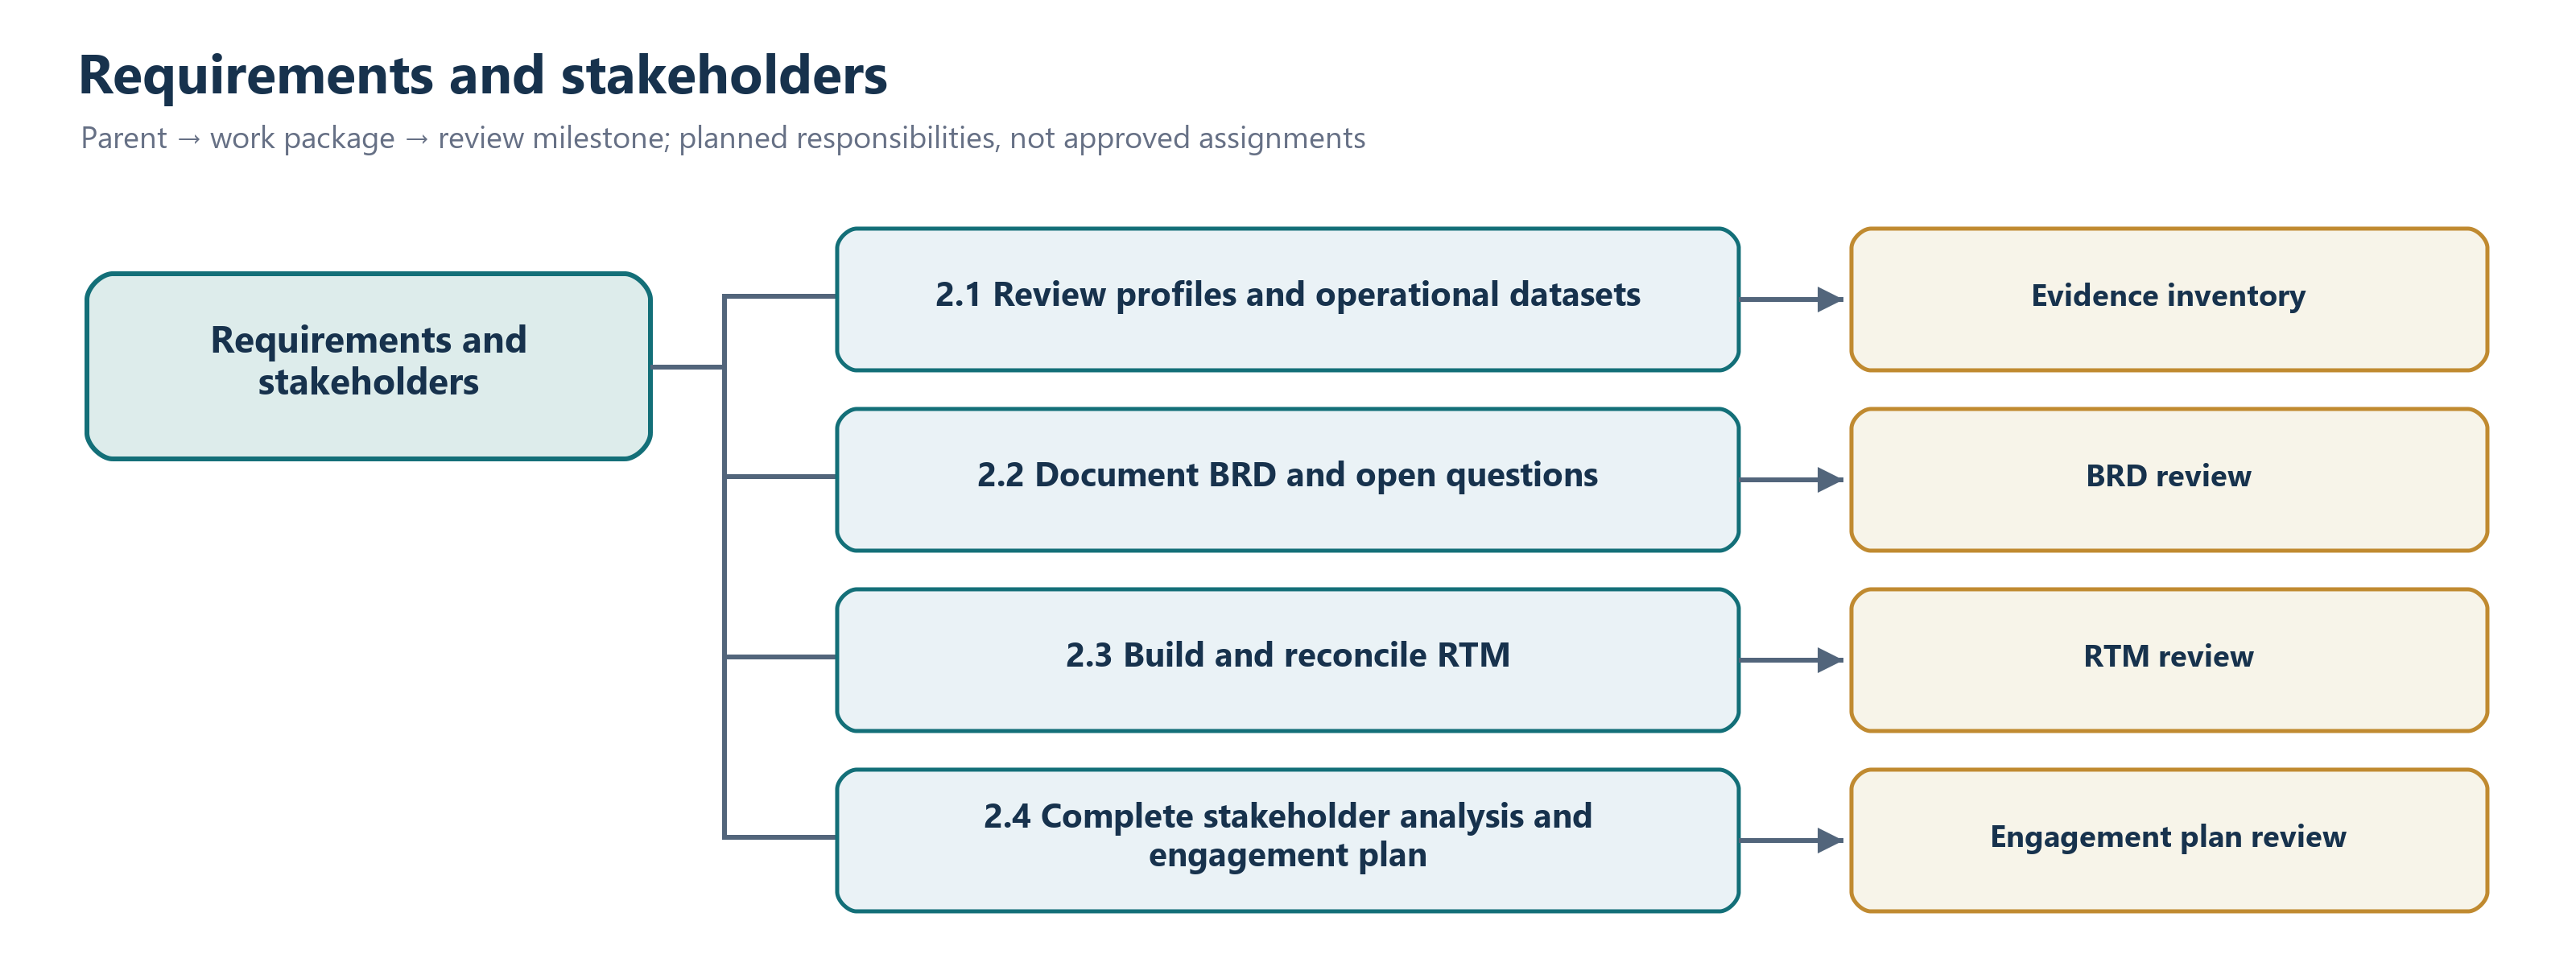
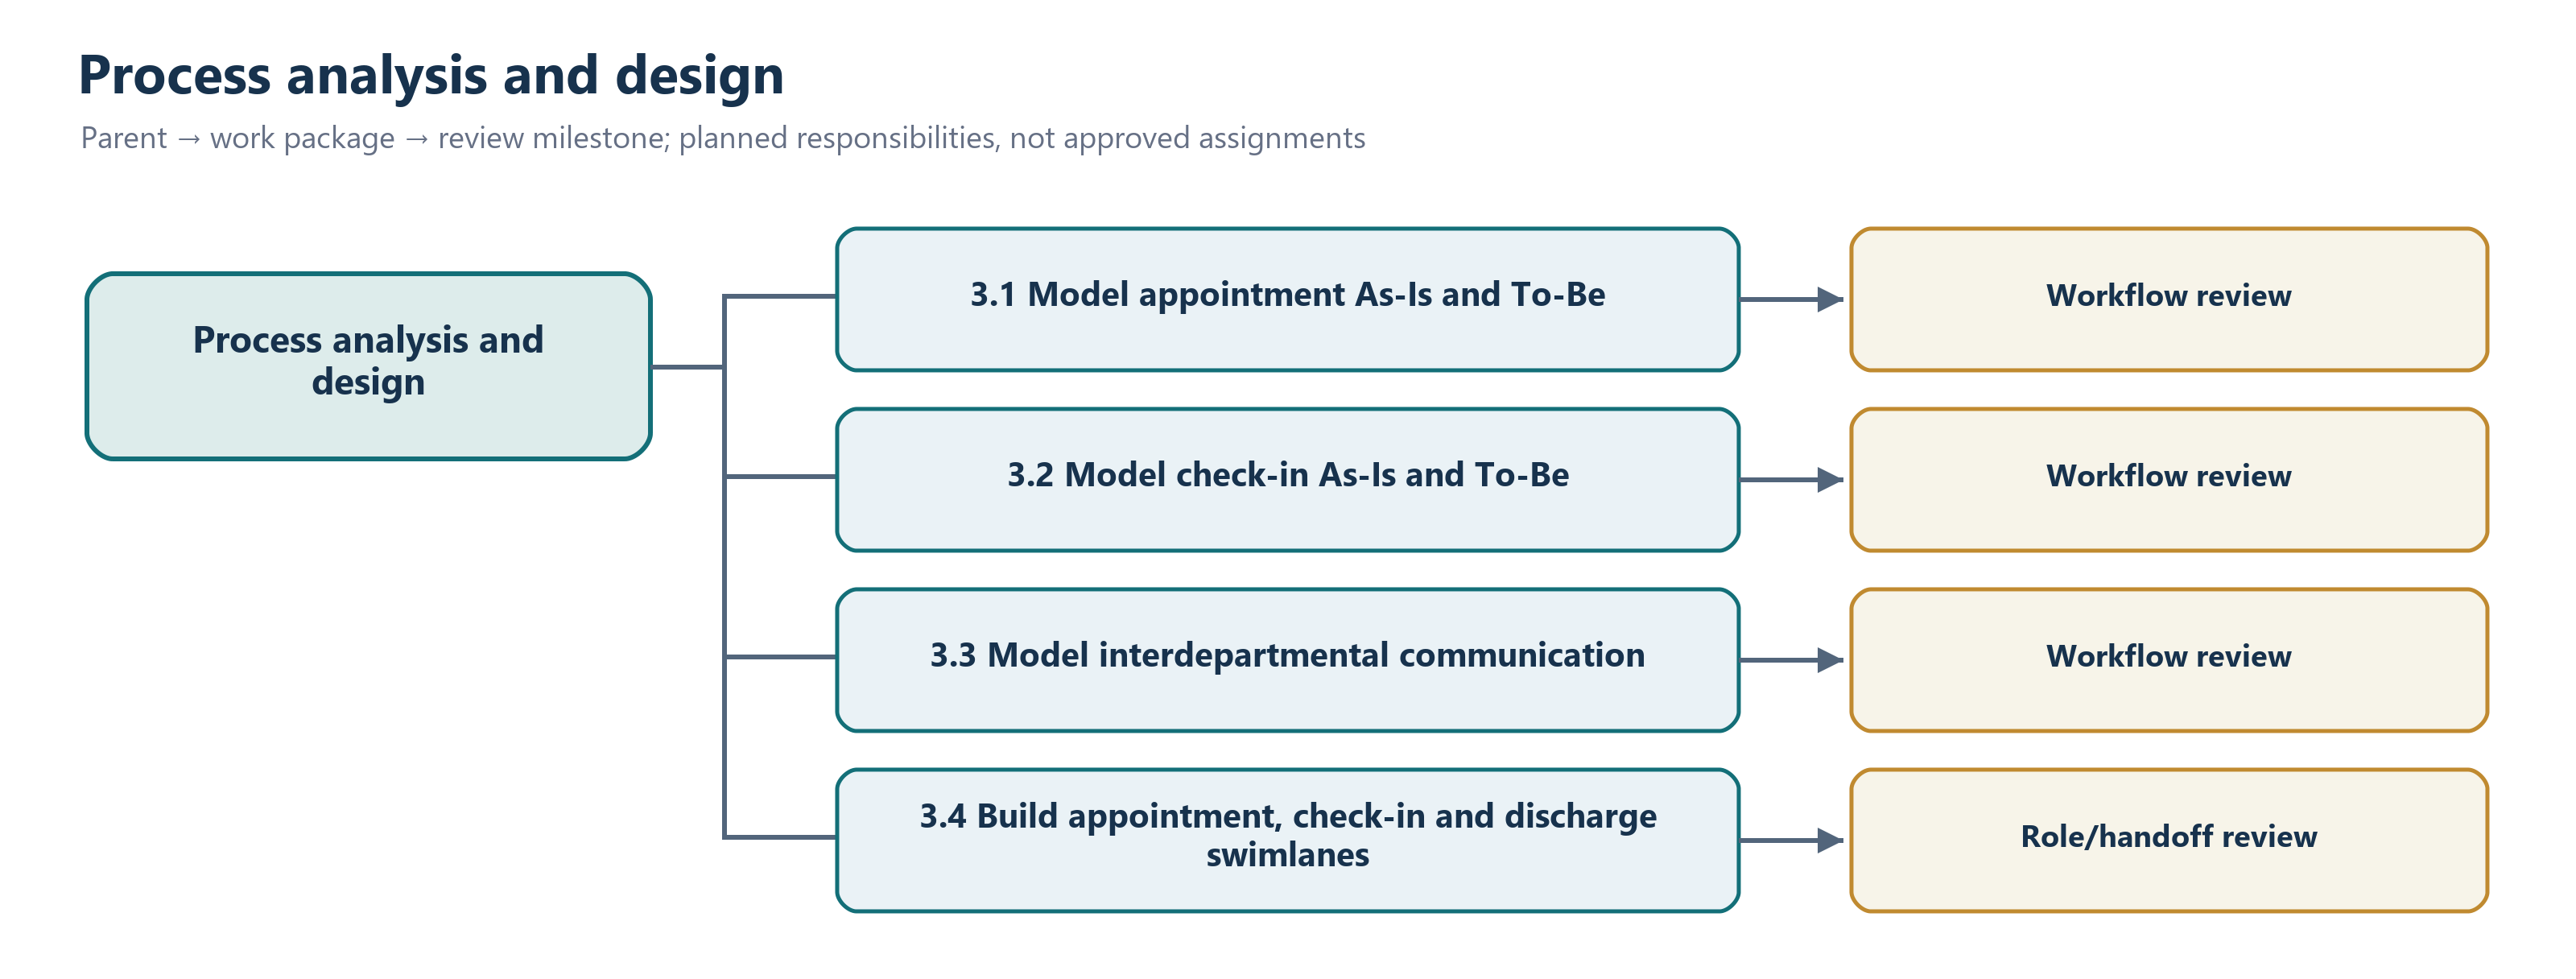
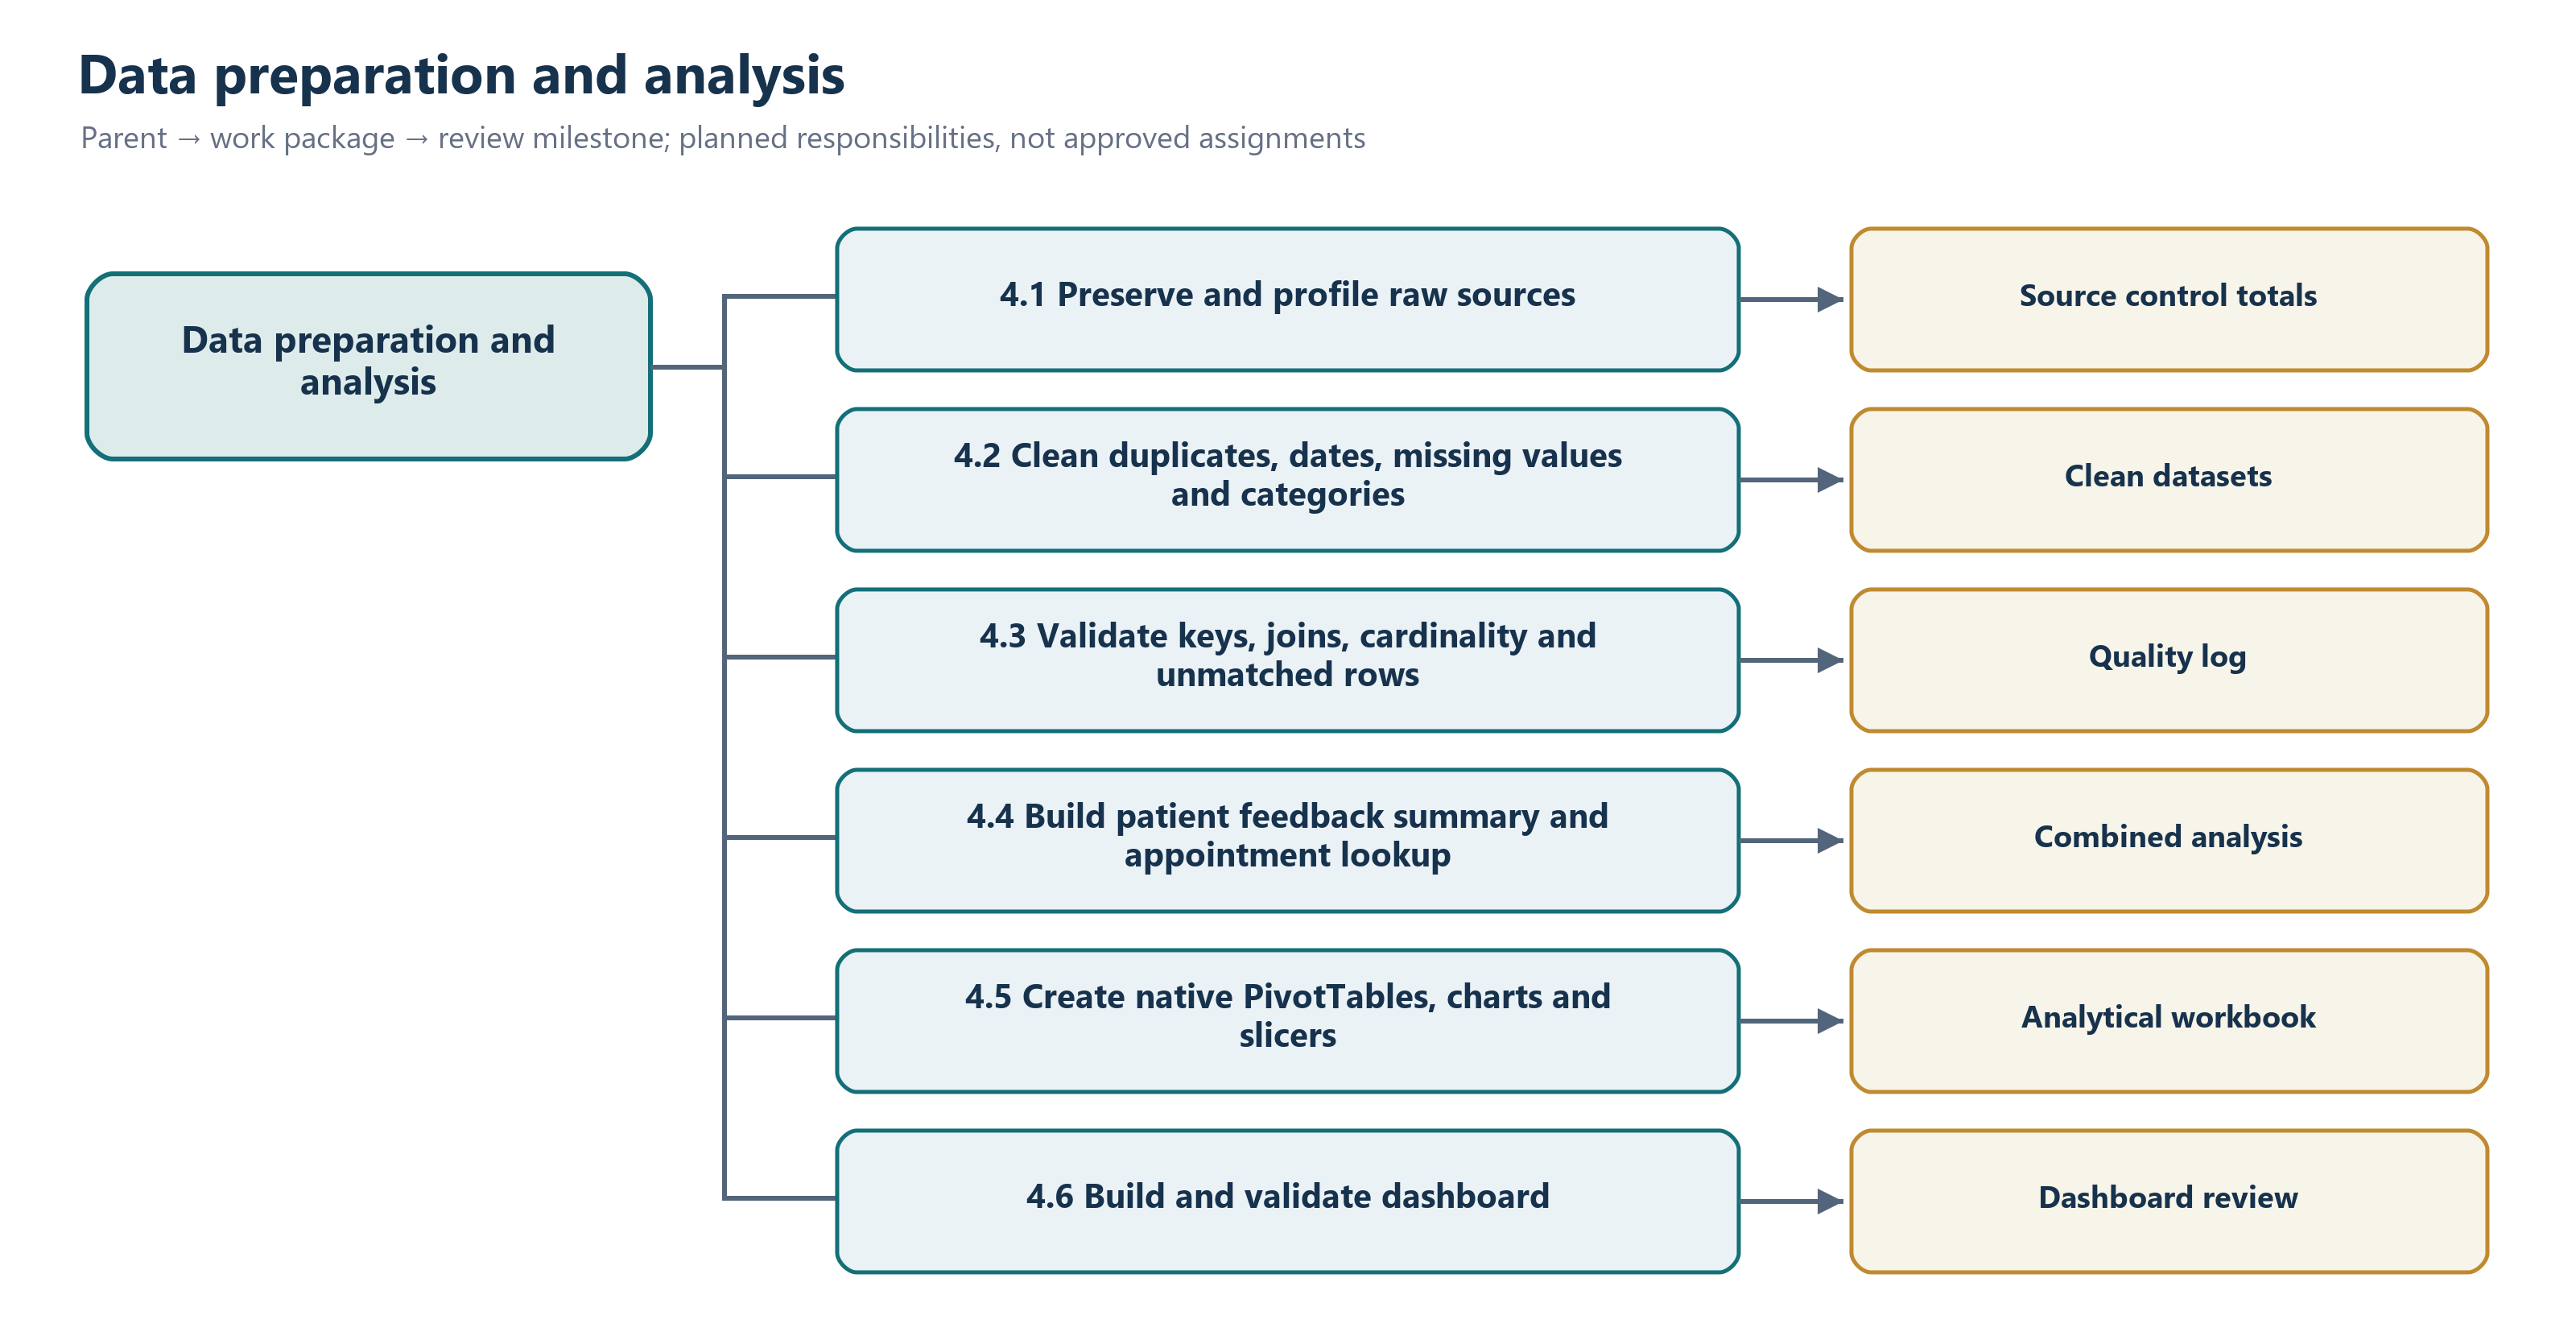
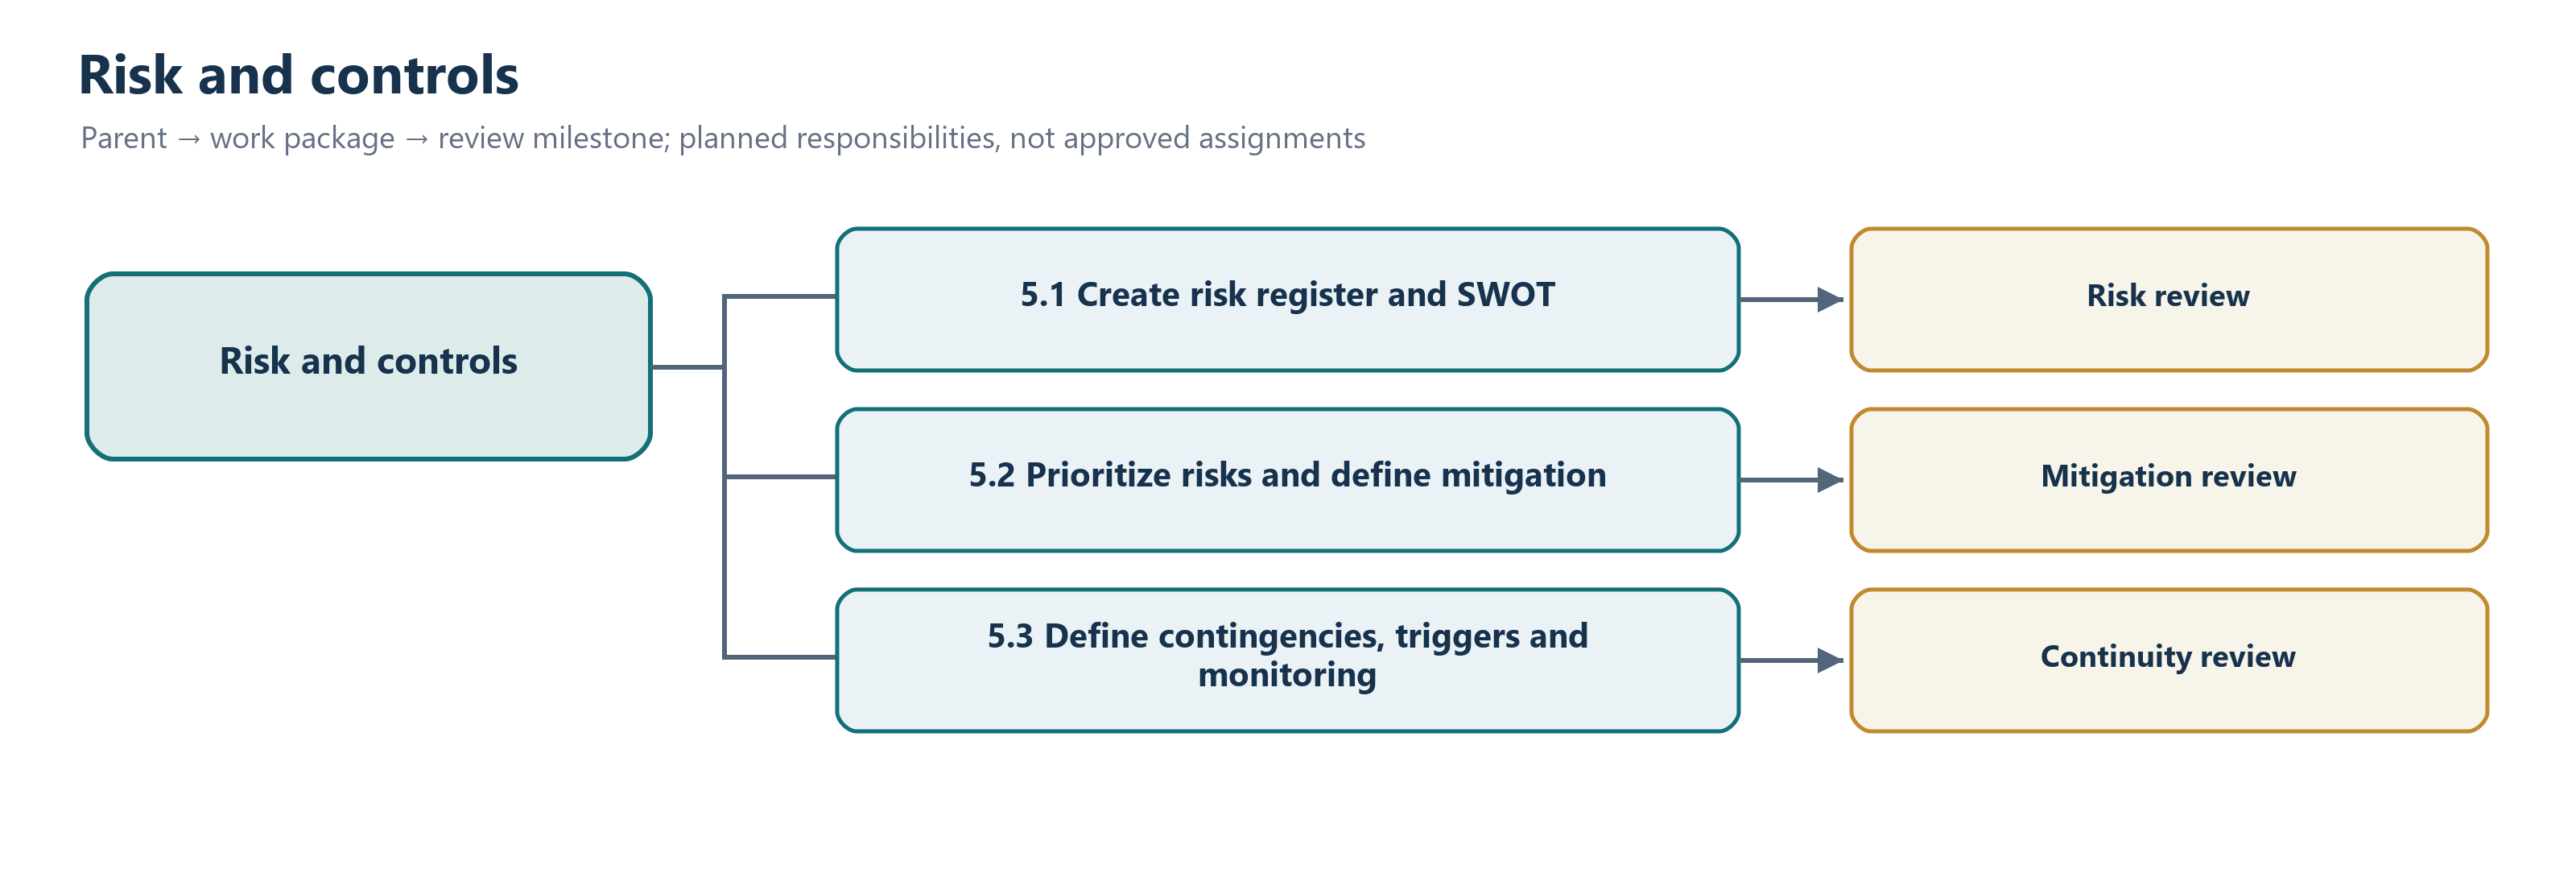
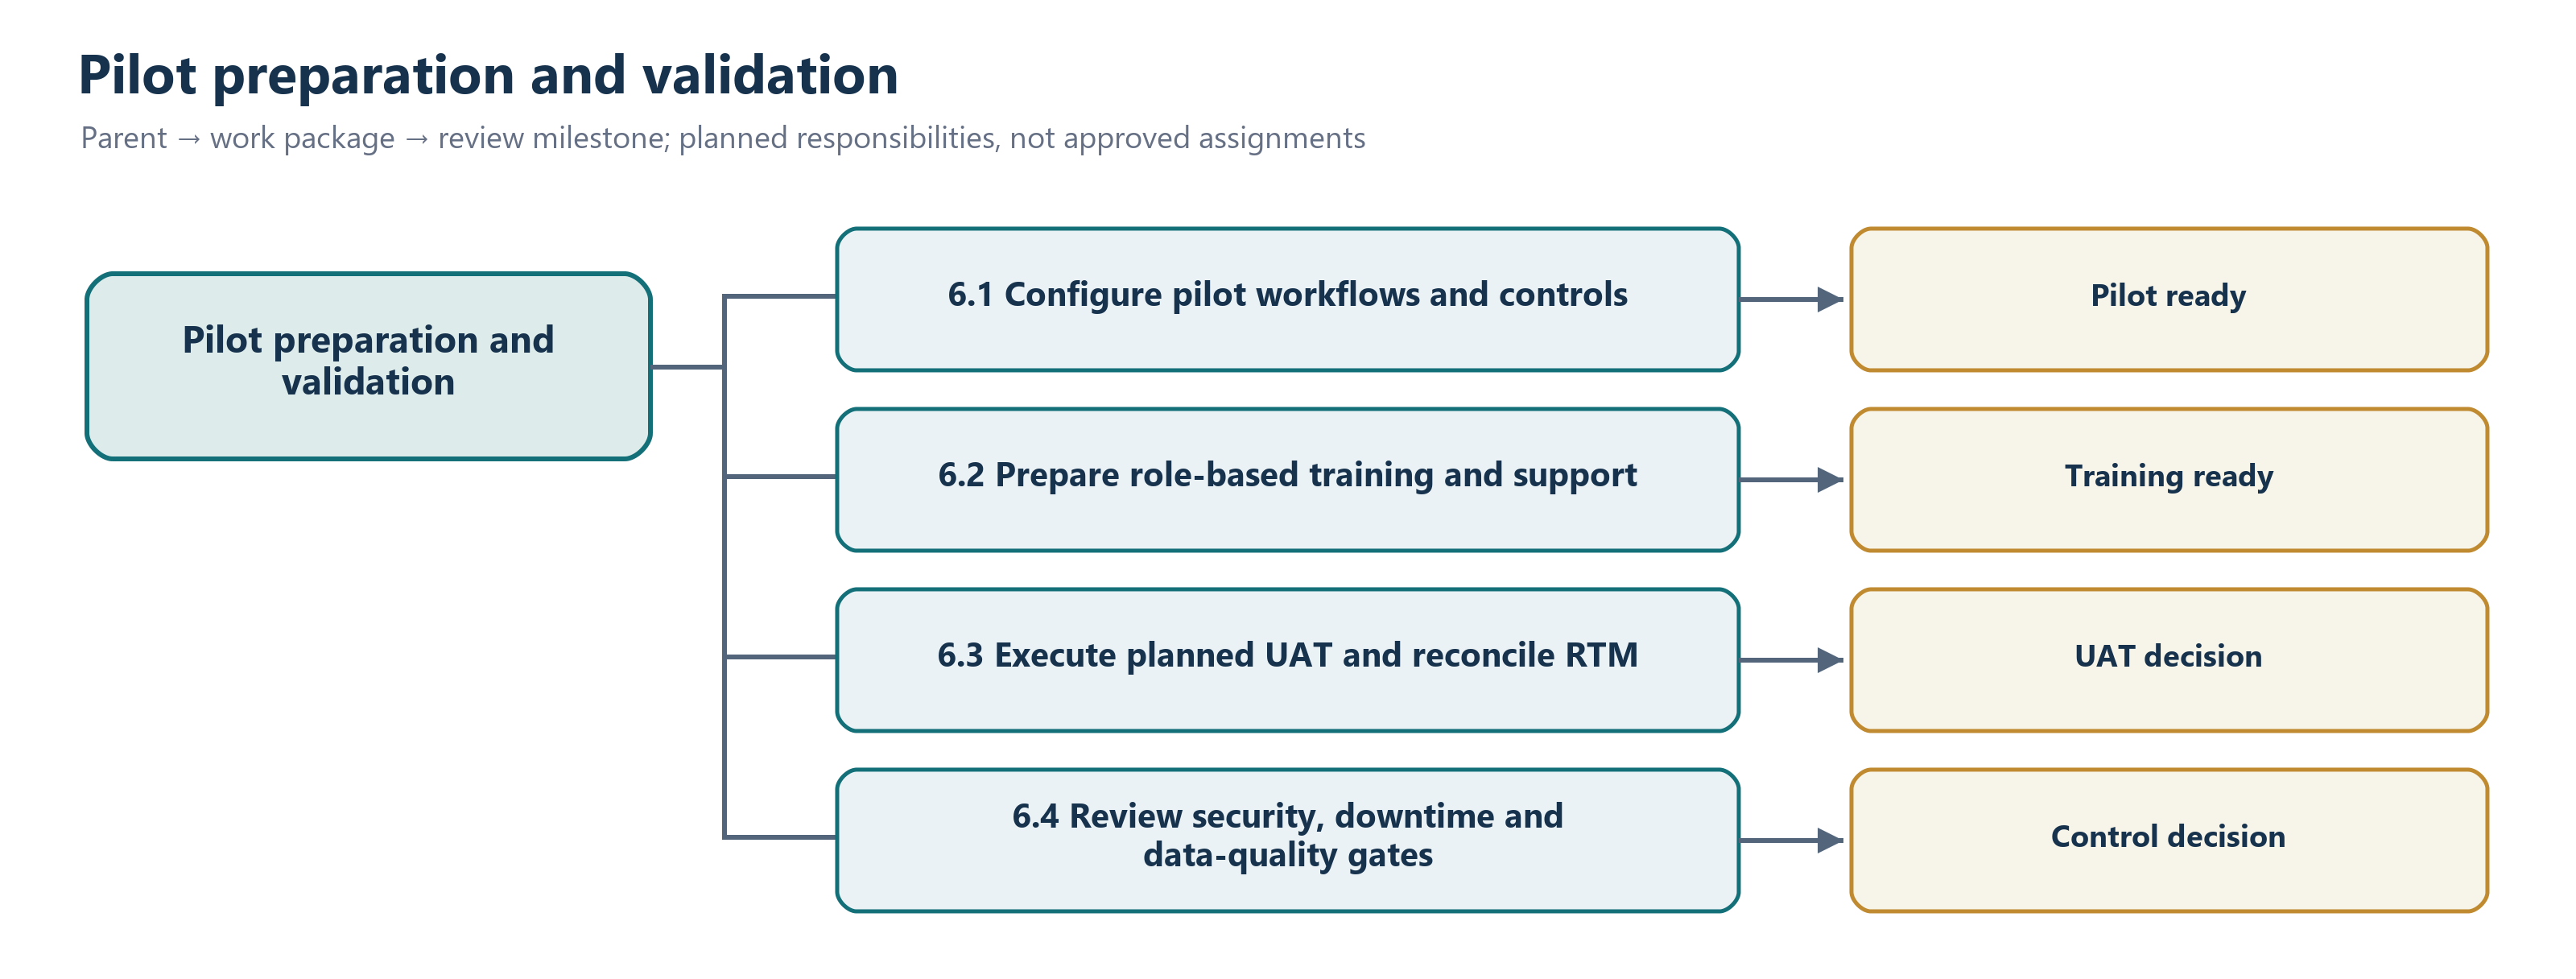
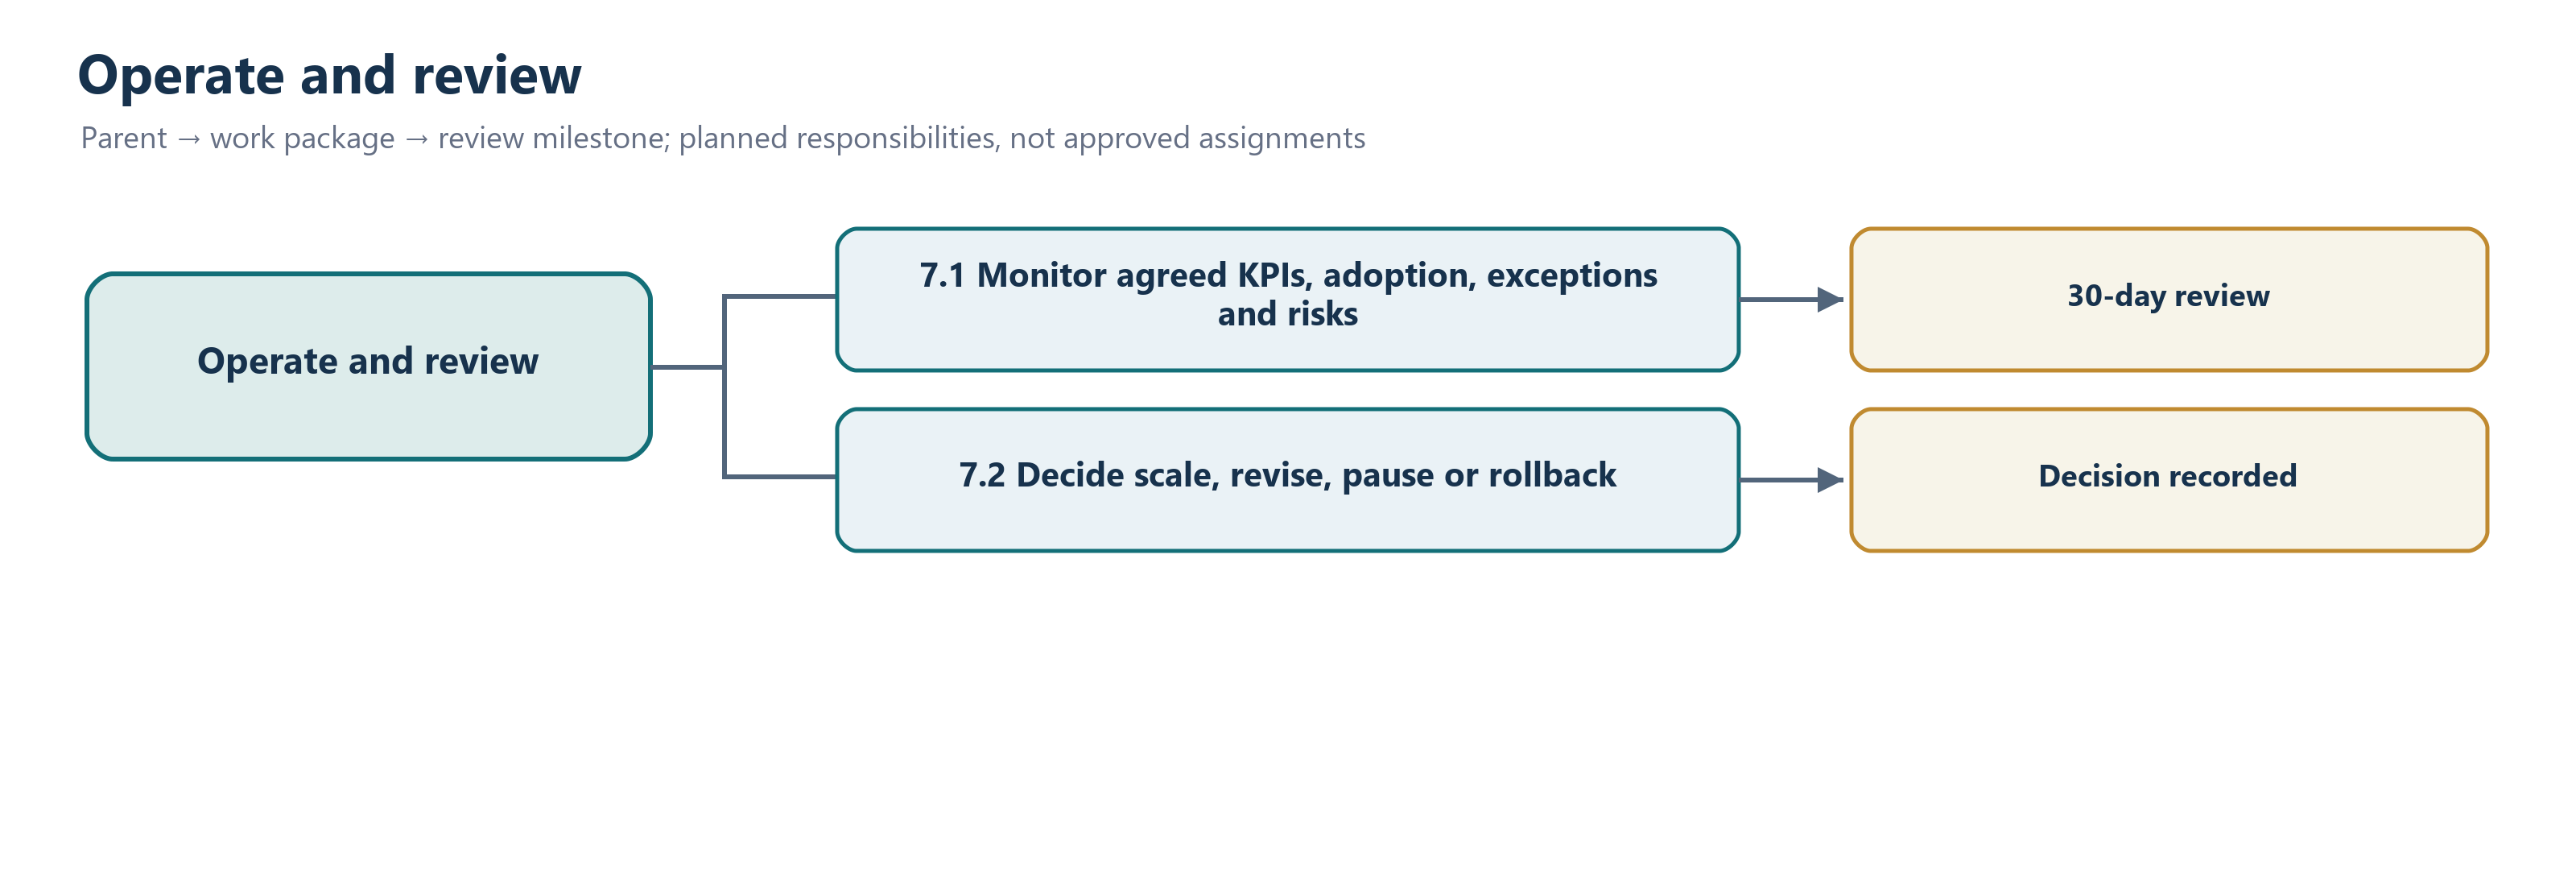
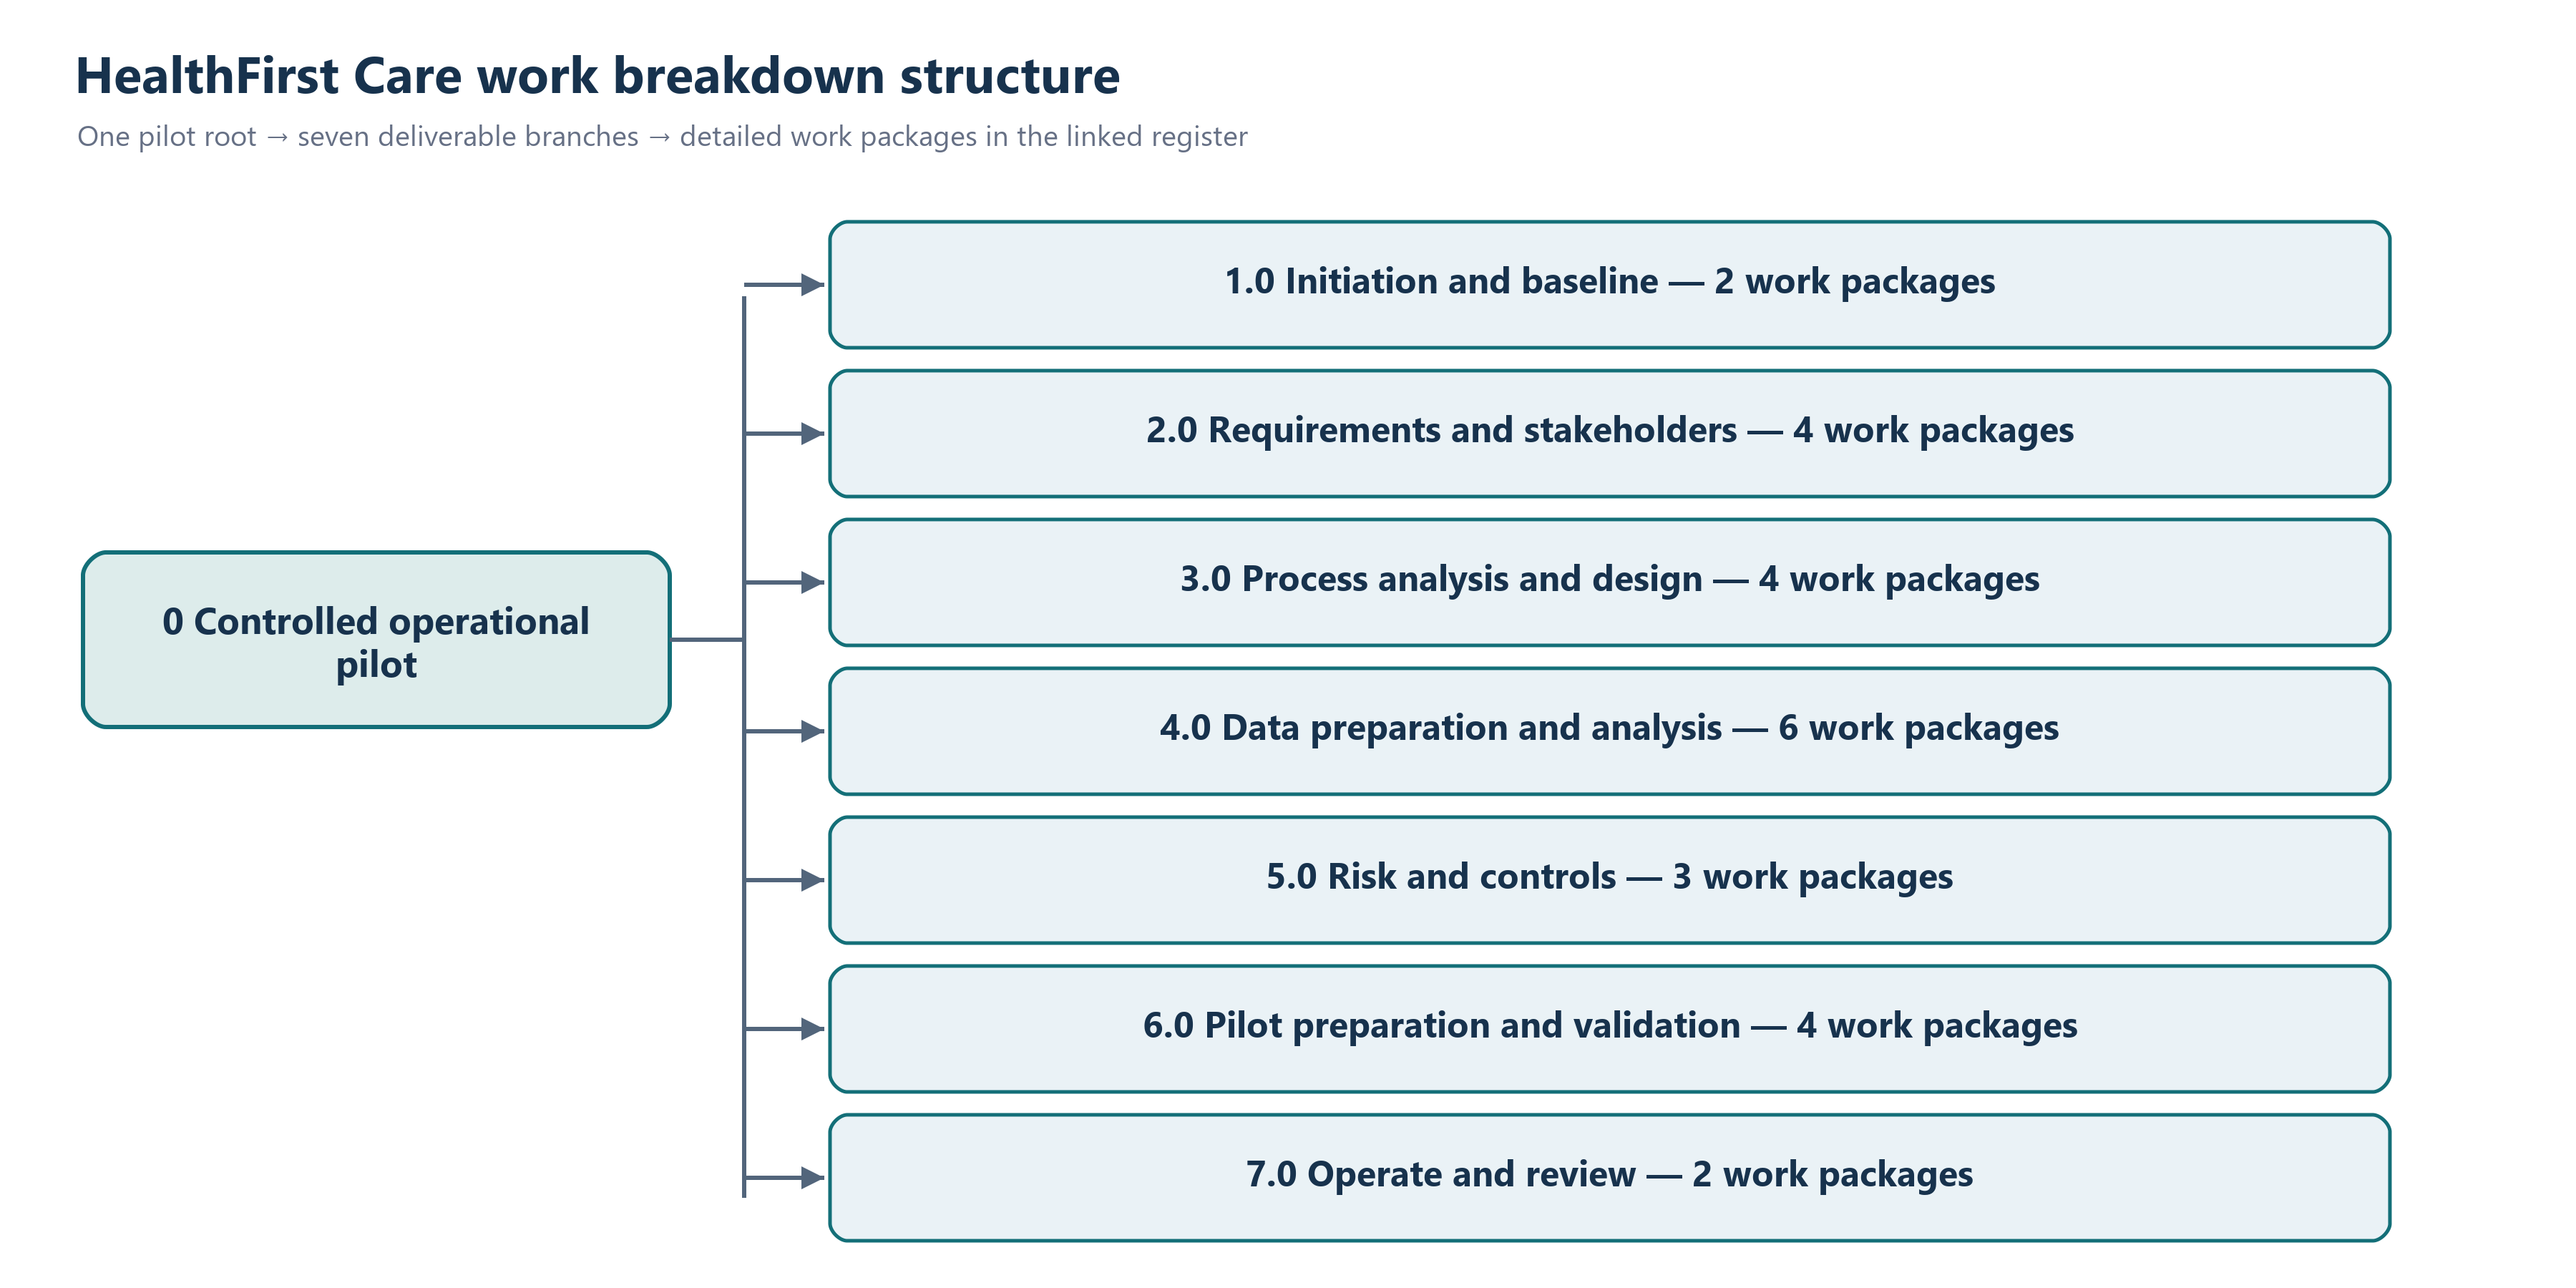
Scope/change-control report, WBS workbook and editable hierarchy and branch diagrams.
4. As-Is and To-Be models
Partial: tool requirement
Editable local SVG process models exist; requested Lucidchart/Visio authoring is unfulfilled.
5. Process maps and swimlanes
Partial: BPMN notation
Editable role-lane diagrams exist; BPMN conformance has not been validated.
6. Data cleaning and analysis
Local complete; review open
Separate analysis workbook and report, native pivots, slicers and charts.
7. Dashboard
Partial: platform requirement
Excel dashboard, interaction guide and PDF exist; the Cognos/Looker exercise is unfulfilled.
8. Risk register and SWOT
Local complete; review open
Ten-risk register, SWOT, controls, triggers and report.
9. Risk matrix and mitigation
Local complete; review open
Dynamic matrix, mitigation workbook, owners and contingency plans.
Scope and limitations
- Course profiles and datasets are simulated. The pack does not claim hospital approval, executed UAT, deployment, pilot results or measured operational benefits.
- Native PivotTables and slicers need desktop Excel for the verified interaction. Browser previews and other spreadsheet applications may not preserve every control.
- The earlier 39-slide hospital case study uses a separate dataset. Its 206 valid appointment records and findings are not the basis of the nine-lab capstone.
Next steps
- Review the completed local lab outputs against stakeholder requirements.
- Complete the specified Lucidchart/Visio and Cognos/Looker exercises and validate BPMN notation.
- Agree acceptance criteria and execute UAT before any real deployment or benefit claim.
Reports and editable project files
Start with the two-page project index. The separate reports, editable Word documents, seven Excel workbooks and SVG diagrams are linked below. Their original directory structure is preserved for relative index links; use this page's direct links when viewing in a browser. Standalone source CSVs are not redistributed.
XLSX, DOCX and PPTX links download the original editable files for their desktop applications. PDFs and image previews can be read in the browser.
Editable reports 10 files
- M01L01 HealthFirst BRDDOCX · 45 KB
- M01L01 RTM FindingsDOCX · 42 KB
- M02L01 Stakeholder AnalysisDOCX · 72 KB
- M02L02 Scope ManagementDOCX · 201 KB
- M03L01 Process ModelDOCX · 867 KB
- M03L02 Swimlane DiagramsDOCX · 643 KB
- M04L01 Data AnalysisDOCX · 255 KB
- M04L02 Dashboard EvidenceDOCX · 93 KB
- M05L01 Risk Register SWOTDOCX · 171 KB
- M05L02 Risk Matrix MitigationDOCX · 171 KB
Reports 10 files
- M01L01 HealthFirst BRDPDF · 124 KB
- M01L01 RTM FindingsPDF · 97 KB
- M02L01 Stakeholder AnalysisPDF · 309 KB
- M02L02 Scope ManagementPDF · 265 KB
- M03L01 Process ModelPDF · 700 KB
- M03L02 Swimlane DiagramsPDF · 560 KB
- M04L01 Data AnalysisPDF · 229 KB
- M04L02 Dashboard EvidencePDF · 172 KB
- M05L01 Risk Register SWOTPDF · 164 KB
- M05L02 Risk Matrix MitigationPDF · 210 KB
Workbooks 7 files
- M01L01 Requirements Traceability MatrixXLSX · 11 KB
- M02L01 Stakeholder MatrixXLSX · 7 KB
- M02L02 Work Breakdown StructureXLSX · 8 KB
- M04L01 Data Cleaning Manipulation AnalysisXLSX · 135 KB
- M04L02 HealthFirst DashboardXLSX · 82 KB
- M05L01 Risk Register SWOTXLSX · 13 KB
- M05L02 Risk Matrix MitigationXLSX · 13 KB
Start here 3 files
Diagram and chart previews 22 files
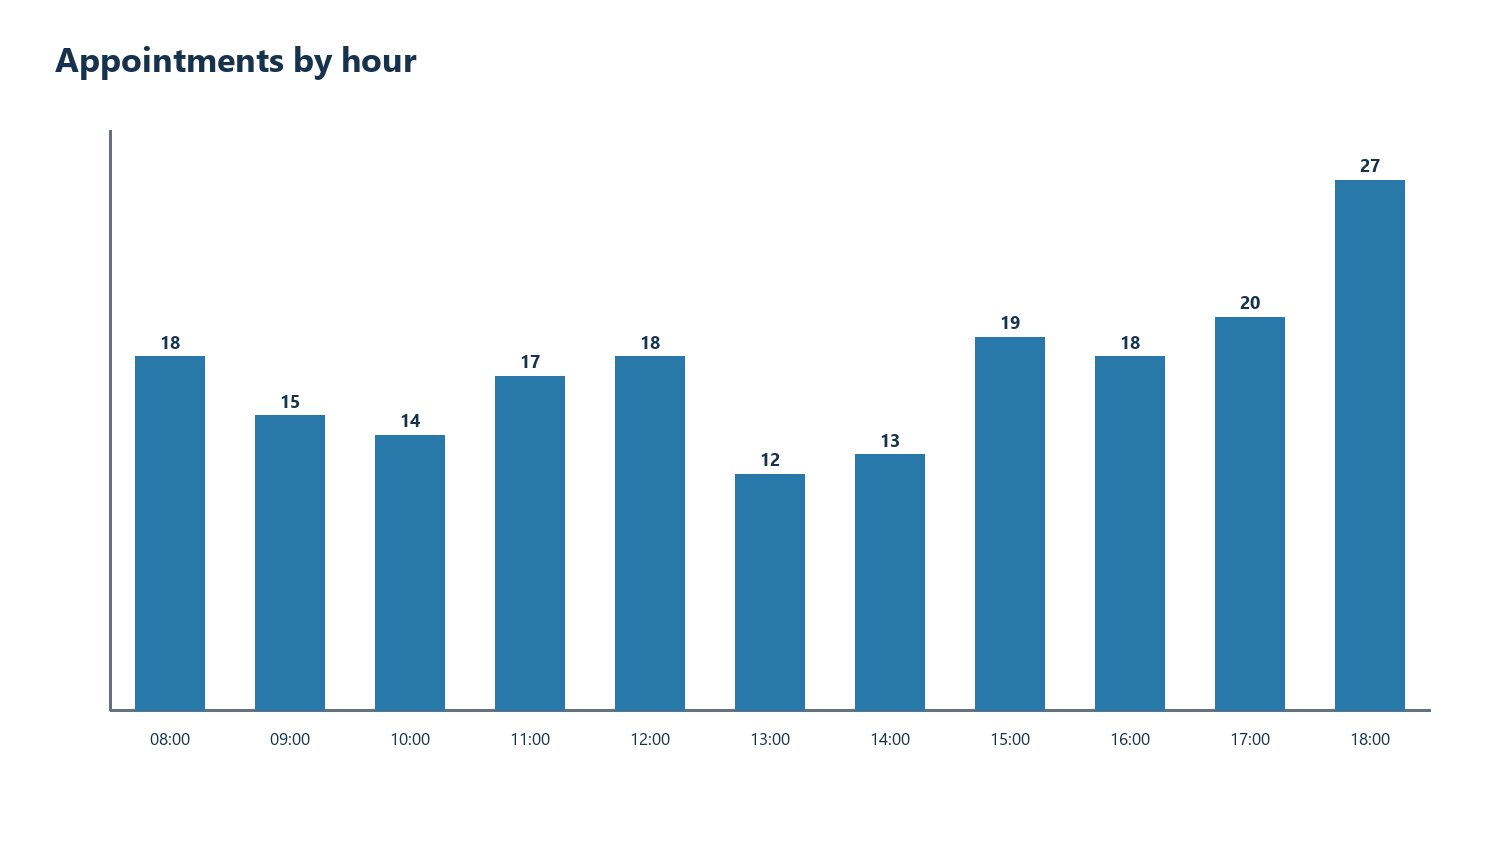
- Appointments by hourPNG · 19 KB
- As is appointmentPNG · 158 KB
- As is checkinPNG · 148 KB
- As is interdepartmentalPNG · 151 KB
- Feedback by departmentPNG · 24 KB
- Resource usage by departmentPNG · 25 KB
- Risk likelihood impact matrixPNG · 146 KB
- Stakeholder influence interest matrixPNG · 33 KB
- Swimlane appointmentPNG · 208 KB
- Swimlane checkin resourcePNG · 174 KB
- Swimlane dischargePNG · 285 KB
- To be appointmentPNG · 164 KB
- To be checkinPNG · 153 KB
- To be interdepartmentalPNG · 157 KB
- Wbs branch 1PNG · 86 KB
- Wbs branch 2PNG · 129 KB
- Wbs branch 3PNG · 131 KB
- Wbs branch 4PNG · 186 KB
- Wbs branch 5PNG · 102 KB
- Wbs branch 6PNG · 130 KB
- Wbs branch 7PNG · 86 KB
- Wbs hierarchyPNG · 180 KB
Editable diagrams 19 files
- As is appointmentSVG · 6 KB
- As is checkinSVG · 6 KB
- As is interdepartmentalSVG · 6 KB
- Risk likelihood impact matrixSVG · 4 KB
- Stakeholder influence interest matrixSVG · 3 KB
- Swimlane appointmentSVG · 8 KB
- Swimlane checkin resourceSVG · 7 KB
- Swimlane dischargeSVG · 10 KB
- To be appointmentSVG · 6 KB
- To be checkinSVG · 6 KB
- To be interdepartmentalSVG · 6 KB
- Wbs branch 1SVG · 3 KB
- Wbs branch 2SVG · 4 KB
- Wbs branch 3SVG · 4 KB
- Wbs branch 4SVG · 6 KB
- Wbs branch 5SVG · 4 KB
- Wbs branch 6SVG · 4 KB
- Wbs branch 7SVG · 3 KB
- Wbs hierarchySVG · 4 KB