Can historical recipe features help a product manager choose homepage recipes likely to be marked High traffic, with at least 80% precision?
DataCamp data science project · ANALYSIS COMPLETE | Pilot proposed
I analysed 947 recipes and compared a simple baseline, logistic regression and a random forest. The aim was to test a selection rule for the homepage, balancing the proportion of selected recipes marked High against how many recipes the rule could select.
What the work shows
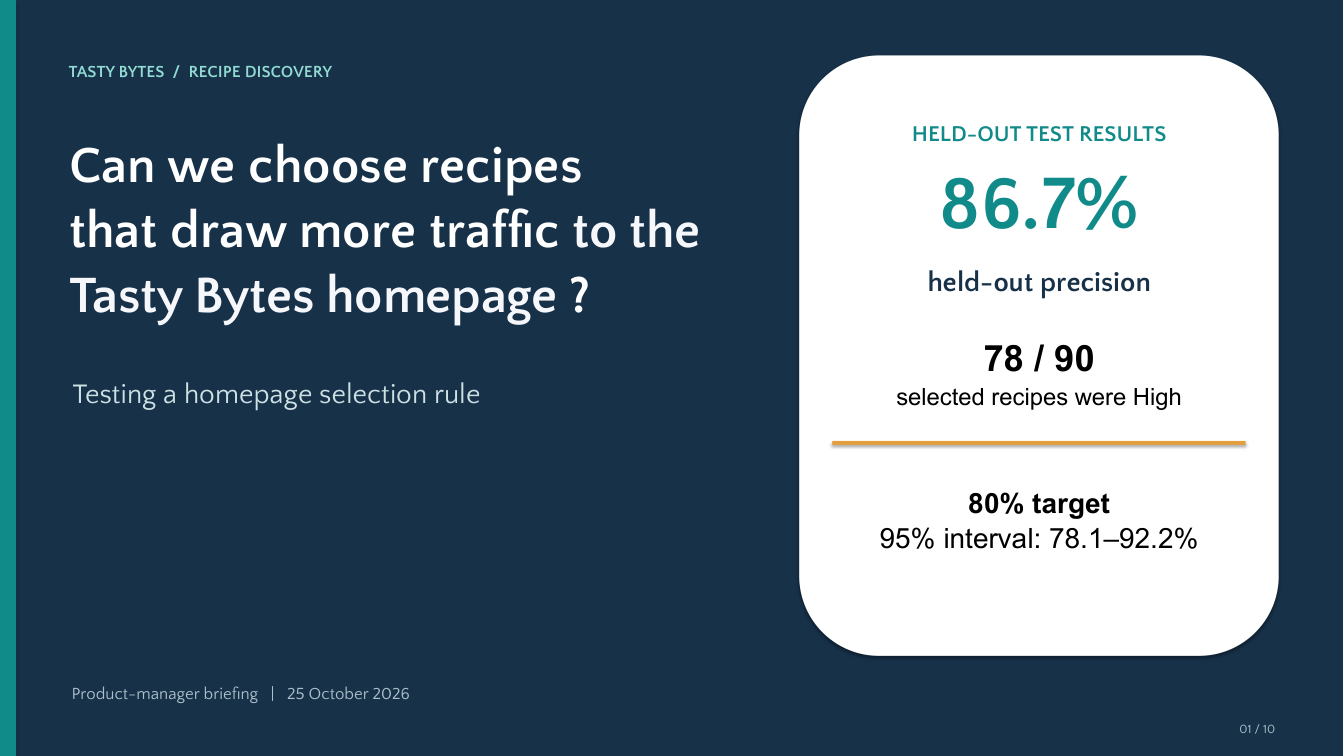
- Held-out precision
- 86.7%
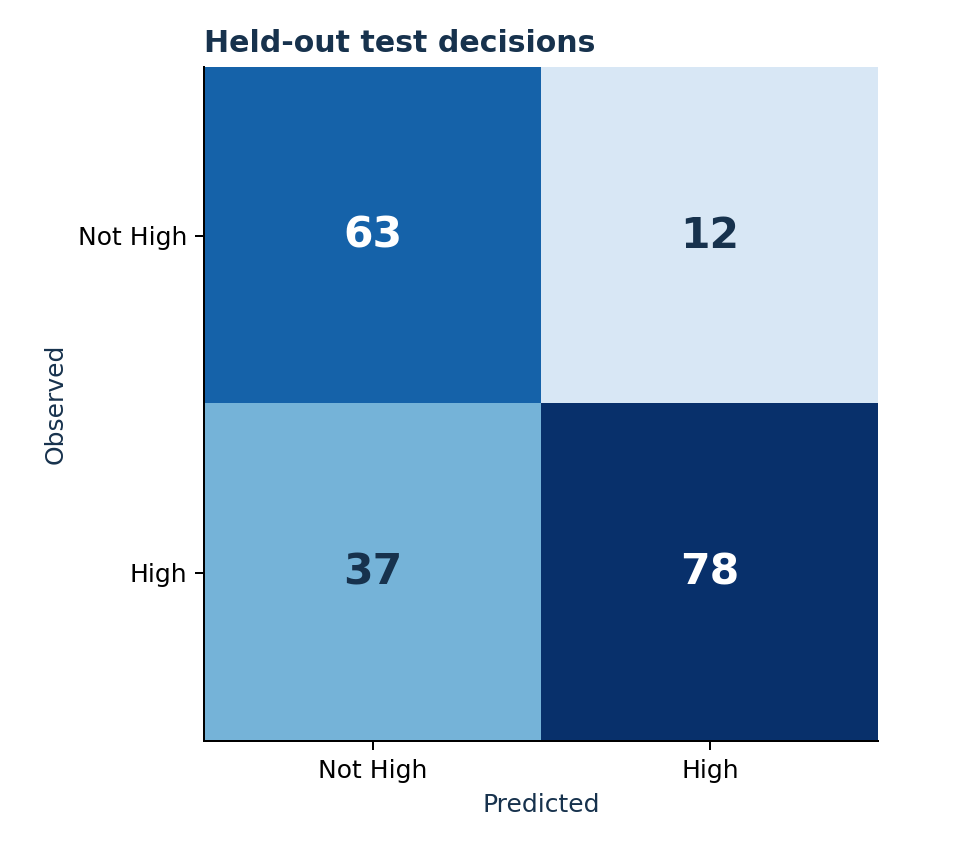
78 of 90 selected recipes were marked High on the untouched test split.
- Selection coverage
- 47.4%
The forest selected 90 of 190 test recipes, with 67.8% recall.
- 95% Wilson interval
- 78.1–92.2%
The interval extends below the 80% target, so the point estimate is not a guaranteed live hit rate.
- Select-all baseline
- 60.5%
The observed precision difference was 26.1 percentage points on the same test split.
Approach and tools
I kept training, validation and test data separate in a stratified 60/20/20 split. Preprocessing and nutrient imputation were fitted within the training pipeline, and the decision threshold was selected using validation data.
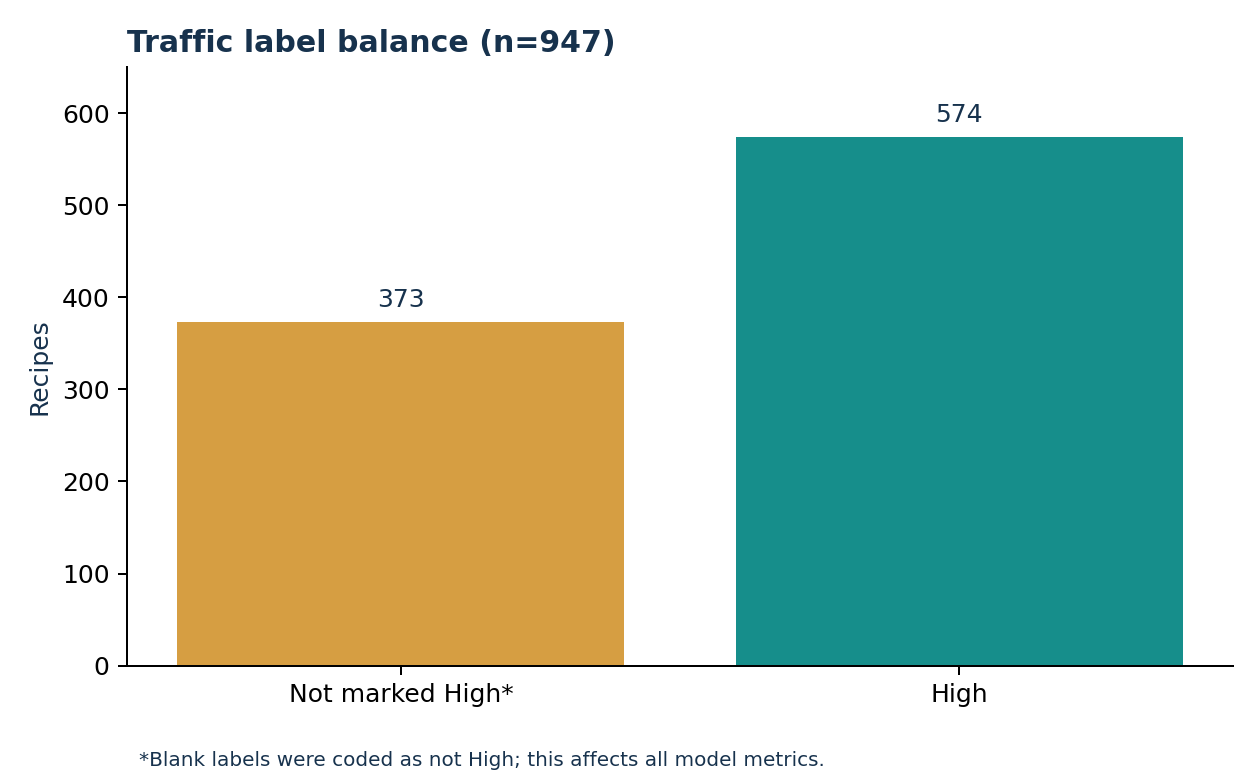
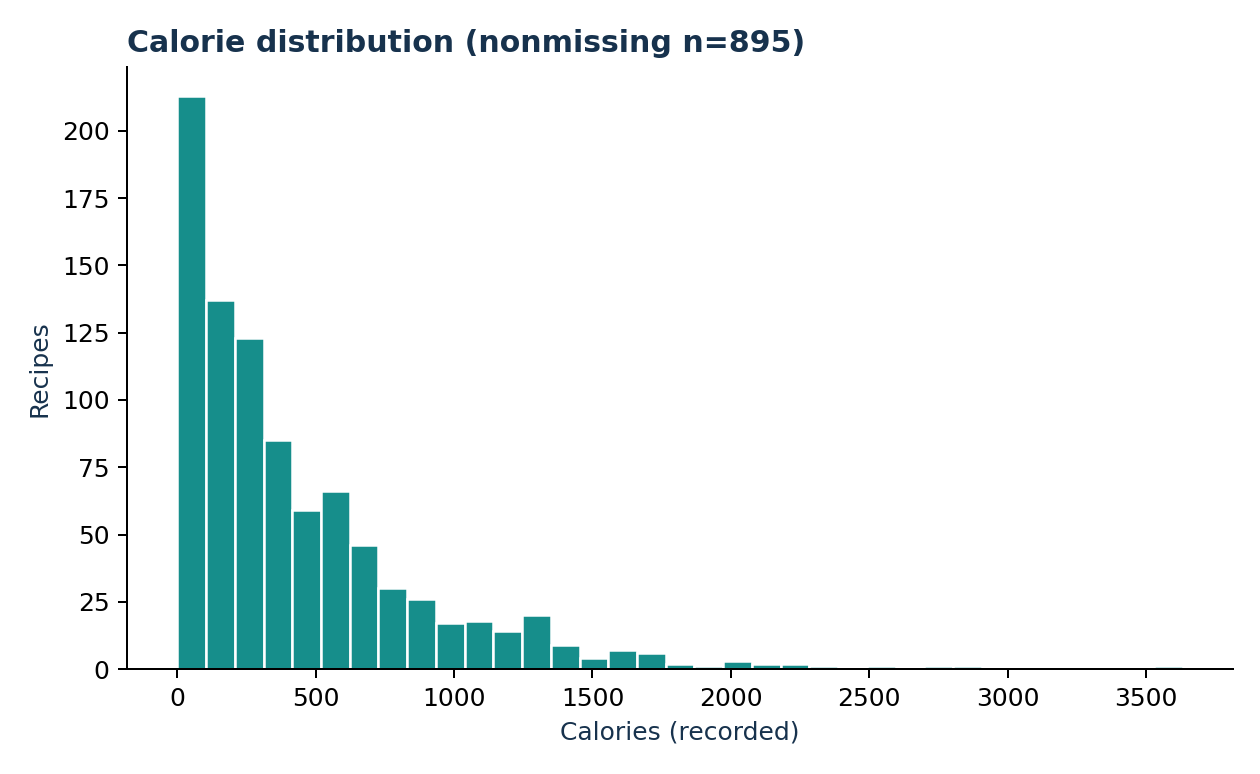
The data contained 373 blank high_traffic labels and 52 recipes missing all four nutrient values. Blank labels were provisionally treated as not-High. I retained Chicken Breast as an observed eleventh category and cleaned three servings values containing 'as a snack'.
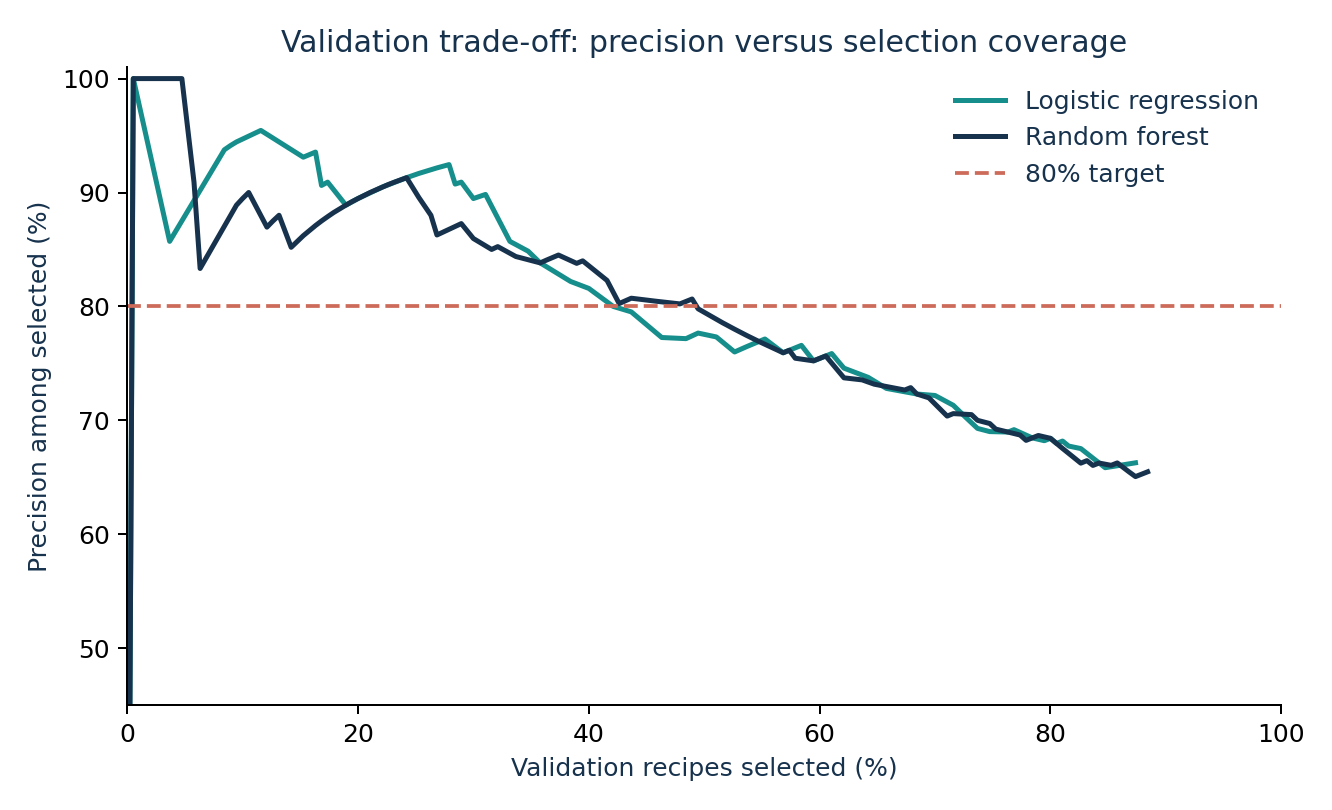
At the chosen validation thresholds, the random forest selected 93 recipes, of which 75 were High: 80.6% precision and 48.9% coverage. Logistic regression selected 80, of which 64 were High: 80.0% precision and 42.1% coverage.
- Python
- pandas
- NumPy
- scikit-learn
- Matplotlib
- DataCamp DataLab
- Google Slides
- PowerPoint
Scope and limitations
- The meaning of blank traffic labels needs confirmation with the product or data team. The results depend on the provisional not-High interpretation.
- Where narrative figures in the original export differ from its computed tables, this summary follows the reproducible analysis. The tested random-forest threshold is 0.6425; narrative passages also mention 0.6558.
- This is a historical classification analysis. It does not establish causal traffic lift, subscription gains or an operational 80% success rate.
Next steps
- Confirm the target-label definition and the features available when a recipe is selected.
- Log candidate recipes, selections and observed outcomes in shadow mode.
- Run a randomized pilot with precision, coverage, site traffic, subscriptions and guardrails agreed in advance.
Reports and editable project files
The nine-page PDF is the actual DataLab report export and is image-based, with no selectable text. Some table columns are clipped in that original print export; this readable summary and the model-results JSON provide the verified figures. The ten-slide PDF is a static export; download the PPTX and open it in PowerPoint for its animations and transitions. The original dataset is linked rather than redistributed here.
XLSX, DOCX and PPTX links download the original editable files for their desktop applications. PDFs and image previews can be read in the browser.